Citibank 2011 Annual Report Download - page 42
Download and view the complete annual report
Please find page 42 of the 2011 Citibank annual report below. You can navigate through the pages in the report by either clicking on the pages listed below, or by using the keyword search tool below to find specific information within the annual report.-
 1
1 -
2
-
3
-
4
-
5
-
6
-
7
-
8
-
9
-
10
-
11
-
12
-
13
-
14
-
15
-
16
-
17
-
18
-
19
-
20
-
21
-
22
-
23
-
24
-
25
-
26
-
27
-
28
-
29
-
30
-
31
-
 32
32 -
 33
33 -
 34
34 -
 35
35 -
 36
36 -
 37
37 -
 38
38 -
 39
39 -
 40
40 -
 41
41 -
 42
42 -
 43
43 -
 44
44 -
 45
45 -
 46
46 -
 47
47 -
 48
48 -
 49
49 -
 50
50 -
 51
51 -
 52
52 -
53
-
54
-
55
-
56
-
57
-
58
-
59
-
60
-
61
-
62
-
63
-
64
-
65
-
66
-
67
-
68
-
69
-
70
-
71
-
72
-
73
-
74
-
75
-
76
-
77
-
78
-
79
-
80
-
81
-
82
-
83
-
84
-
85
-
86
-
87
-
88
-
89
-
90
-
91
-
92
-
93
-
94
-
95
-
96
-
97
-
98
-
99
-
100
-
101
-
102
-
103
-
104
-
105
-
106
-
107
-
108
-
109
-
110
-
111
-
112
-
113
-
114
-
115
-
116
-
117
-
118
-
119
-
120
-
121
-
122
-
123
-
124
-
125
-
126
-
127
-
128
-
129
-
130
-
131
-
132
-
133
-
134
-
135
-
136
-
137
-
138
-
139
-
140
-
141
-
142
-
143
-
144
-
145
-
146
-
147
-
148
-
149
-
150
-
151
-
152
-
153
-
154
-
155
-
156
-
157
-
158
-
159
-
160
-
161
-
162
-
163
-
164
-
165
-
166
-
167
-
168
-
169
-
170
-
171
-
172
-
173
-
174
-
175
-
176
-
177
-
178
-
179
-
180
-
181
-
182
-
183
-
184
-
185
-
186
-
187
-
188
-
189
-
190
-
191
-
192
-
193
-
194
-
195
-
196
-
197
-
198
-
199
-
200
-
201
-
202
-
203
-
204
-
205
-
206
-
207
-
208
-
209
-
210
-
211
-
212
-
213
-
214
-
215
-
216
-
217
-
218
-
219
-
220
-
221
-
222
-
223
-
224
-
225
-
226
-
227
-
228
-
229
-
230
-
231
-
232
-
233
-
234
-
235
-
236
-
237
-
238
-
239
-
240
-
241
-
242
-
243
-
244
-
245
-
246
-
247
-
248
-
249
-
250
-
251
-
252
-
253
-
254
-
255
-
256
-
257
-
258
-
259
-
260
-
261
-
262
-
263
-
264
-
265
-
266
-
267
-
268
-
269
-
270
-
271
-
272
-
273
-
274
-
275
-
276
-
277
-
278
-
279
-
280
-
281
-
282
-
283
-
284
-
285
-
286
-
287
-
288
-
289
-
290
-
291
-
292
-
293
-
294
-
295
-
296
-
297
-
298
-
299
-
300
-
301
-
302
-
303
-
304
-
305
-
306
-
307
-
308
-
309
-
310
-
311
-
312
-
313
-
314
-
315
-
316
-
317
-
318
-
319
-
320
 |
 |

20
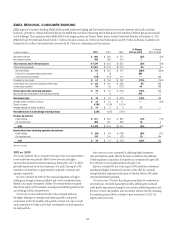
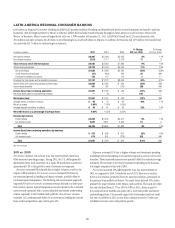
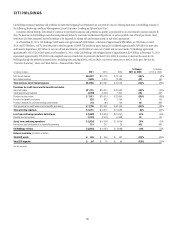
LATIN AMERICA REGIONAL CONSUMER BANKING
Latin America Regional Consumer Banking (LATAM RCB) provides traditional banking and branded card services to retail customers and small to mid-size
businesses, with the largest presence in Mexico and Brazil. LATAM RCB includes branch networks throughout Latin America as well as Banco Nacional de
Mexico, or Banamex, Mexico’s second-largest bank, with over 1,700 branches. At December 31, 2011, LATAM RCB overall had 2,221 retail branches, with
29.2 million customer accounts, $24.0 billion in retail banking loans and $44.8 billion in deposits. In addition, the business had 12.9 million Citi-branded card
accounts with $13.7 billion in outstanding loan balances.
In millions of dollars 2011
% Change
2011 vs. 2010
æ#HANGEæ
æVSæ
.ETæINTERESTæREVENUE $ 6,465 8%
.ONINTERESTæREVENUE 3,018 11
Total revenues, net of interest expense $ 9,483 9%
4OTALæOPERATINGæEXPENSES $ 5,734 11%
.ETæCREDITæLOSSES $ 1,684 (10)%
#REDITæRESERVEæBUILDæRELEASE (67) 92 .-
0ROVISIONæFORæBENEFITSæANDæCLAIMS 130 2
0ROVISIONSæFORæLOANæLOSSESæANDæFORæBENEFITSæANDæCLAIMS $ 1,747 49%
)NCOMEæLOSSæFROMæCONTINUINGæOPERATIONSæBEFOREæTAXES $ 2,002 (15)% .-
)NCOMEæTAXESæBENEFITS 401 (29) .-
Income (loss) from continuing operations $ 1,601 (11)% .-
.ETæLOSSæATTRIBUTABLEæTOæNONCONTROLLINGæINTERESTS — 100
Net income (loss) $ 1,601 (11)% .-
!VERAGEæASSETSæ(in billions of dollars) $80 10%
2ETURNæONæASSETS 2.00%
!VERAGEæDEPOSITS (in billions of dollars) $46 12%
Net credit losses as a percentage of average loans 4.64%
Revenue by business
2ETAILæBANKING $ 5,482 9%
#ITIBRANDEDæCARDS 4,001 10
Total $ 9,483 9%
Income (loss) from continuing operations by business
2ETAILæBANKING $ 923 (2)%
#ITIBRANDEDæCARDS 678 (20) .-
Total $ 1,601 (11)% .-
.-æ .OTæMEANINGFUL
2011 vs. 2010
Net income declined 11% as lower loan loss reserve releases more than
offset increased operating margin. During 2011, the U.S. dollar generally
depreciated versus local currencies. As a result, FX translation contributed
approximately 2% to the growth in each of revenues and expenses.
Revenues increased 9% primarily due to higher volumes as well as the
impact of FX translation. Net interest revenue increased 8% driven by
the continued growth in lending and deposit volumes, partially offset by
continued spread compression. The declining rate environment negatively
impacted Net interest revenue as interest revenue declined at a faster pace
than interest expense. Spread compression was also driven by the continued
move towards customers with a lower risk profile and stricter underwriting
criteria, especially in the branded cards portfolio. Non-interest revenue
increased 11%, predominantly driven by an increase in banking fee income
from credit card purchase sales, which grew 22%.
Expenses increased 11% due to higher volumes and investment spending,
including increased marketing and customer acquisition costs as well as new
branches. These increased expenses were partially offset by continued savings
initiatives. The increase in the level of investment spending in the business
was largely completed at the end of 2011.
Provisions increased 49% reflecting lower loan loss reserve releases in
2011 as compared to 2010. Towards the end of 2011, there was a build in
the loan loss reserves, primarily driven by increased volumes, particularly in
the personal loan portfolio in Mexico. Net credit losses declined 10%, driven
primarily by improvements in the Mexico cards portfolio. The cards net credit
loss ratio declined from 11.7% in 2010 to 8.8% in 2011, driven in part by
the continued move towards customers with a lower risk profile and stricter
underwriting criteria. Citi currently expects the Citi-branded cards net credit
loss ratio to stabilize in 2012 as new loans continue to season. Credit costs
will likely increase in line with portfolio growth.