Citibank 2011 Annual Report Download - page 137
Download and view the complete annual report
Please find page 137 of the 2011 Citibank annual report below. You can navigate through the pages in the report by either clicking on the pages listed below, or by using the keyword search tool below to find specific information within the annual report.-
 1
1 -
2
-
3
-
4
-
5
-
6
-
7
-
8
-
9
-
10
-
11
-
12
-
13
-
14
-
15
-
16
-
17
-
18
-
19
-
20
-
21
-
22
-
23
-
24
-
25
-
26
-
27
-
28
-
29
-
30
-
31
-
32
-
33
-
34
-
35
-
36
-
37
-
38
-
39
-
40
-
41
-
42
-
43
-
44
-
45
-
46
-
47
-
48
-
49
-
50
-
51
-
52
-
53
-
54
-
55
-
56
-
57
-
58
-
59
-
60
-
61
-
62
-
63
-
64
-
65
-
66
-
67
-
68
-
69
-
70
-
71
-
72
-
73
-
74
-
75
-
76
-
77
-
78
-
79
-
80
-
81
-
82
-
83
-
84
-
85
-
86
-
87
-
88
-
89
-
90
-
91
-
92
-
93
-
94
-
95
-
96
-
97
-
98
-
99
-
100
-
101
-
102
-
103
-
104
-
105
-
106
-
107
-
108
-
109
-
110
-
111
-
112
-
113
-
114
-
115
-
116
-
117
-
118
-
119
-
120
-
121
-
122
-
123
-
124
-
125
-
126
-
 127
127 -
 128
128 -
 129
129 -
 130
130 -
 131
131 -
 132
132 -
 133
133 -
 134
134 -
 135
135 -
 136
136 -
 137
137 -
 138
138 -
 139
139 -
 140
140 -
 141
141 -
 142
142 -
 143
143 -
 144
144 -
 145
145 -
 146
146 -
 147
147 -
148
-
149
-
150
-
151
-
152
-
153
-
154
-
155
-
156
-
157
-
158
-
159
-
160
-
161
-
162
-
163
-
164
-
165
-
166
-
167
-
168
-
169
-
170
-
171
-
172
-
173
-
174
-
175
-
176
-
177
-
178
-
179
-
180
-
181
-
182
-
183
-
184
-
185
-
186
-
187
-
188
-
189
-
190
-
191
-
192
-
193
-
194
-
195
-
196
-
197
-
198
-
199
-
200
-
201
-
202
-
203
-
204
-
205
-
206
-
207
-
208
-
209
-
210
-
211
-
212
-
213
-
214
-
215
-
216
-
217
-
218
-
219
-
220
-
221
-
222
-
223
-
224
-
225
-
226
-
227
-
228
-
229
-
230
-
231
-
232
-
233
-
234
-
235
-
236
-
237
-
238
-
239
-
240
-
241
-
242
-
243
-
244
-
245
-
246
-
247
-
248
-
249
-
250
-
251
-
252
-
253
-
254
-
255
-
256
-
257
-
258
-
259
-
260
-
261
-
262
-
263
-
264
-
265
-
266
-
267
-
268
-
269
-
270
-
271
-
272
-
273
-
274
-
275
-
276
-
277
-
278
-
279
-
280
-
281
-
282
-
283
-
284
-
285
-
286
-
287
-
288
-
289
-
290
-
291
-
292
-
293
-
294
-
295
-
296
-
297
-
298
-
299
-
300
-
301
-
302
-
303
-
304
-
305
-
306
-
307
-
308
-
309
-
310
-
311
-
312
-
313
-
314
-
315
-
316
-
317
-
318
-
319
-
320
 |
 |

115
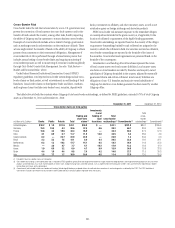
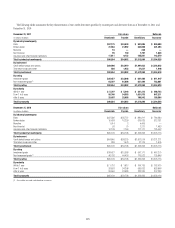
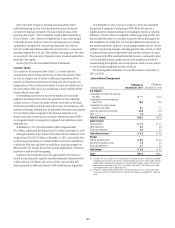
The following tables summarize the key characteristics of Citi’s credit derivatives portfolio by counterparty and derivative form as of December 31, 2011 and
December 31, 2010:
December 31, 2011 Fair values Notionals
In millions of dollars Receivable Payable Beneficiary Guarantor
By industry/counterparty
"ANK $57,175 $ 53,638 $ 981,085 $ 929,608
"ROKERDEALER 21,963 21,952 343,909 321,293
-ONOLINE 10 — 238 —
.ONFINANCIAL 95 130 1,797 1,048
)NSURANCEæANDæOTHERæFINANCIALæINSTITUTIONS 11,611 9,132 185,861 142,579
Total by industry/counterparty $90,854 $ 84,852 $1,512,890 $1,394,528
By instrument
#REDITæDEFAULTæSWAPSæANDæOPTIONS $89,998 $ 83,419 $1,491,053 $1,393,082
4OTALæRETURNæSWAPSæANDæOTHER 856 1,433 21,837 1,446
Total by instrument $90,854 $ 84,852 $1,512,890 $1,394,528
By rating
)NVESTMENTæGRADE $26,457 $ 23,846 $ 681,406 $ 611,447
.ONINVESTMENTæGRADEæ 64,397 61,006 831,484 783,081
Total by rating $90,854 $ 84,852 $1,512,890 $1,394,528
By maturity
7ITHINææYEAR $ 5,707 $ 5,244 $ 281,373 $ 266,723
&ROMææTOææYEARS 56,740 54,553 1,031,575 947,211
!FTERææYEARS 28,407 25,055 199,942 180,594
Total by maturity $90,854 $ 84,852 $1,512,890 $1,394,528
December 31, 2010 Fair values Notionals
In millions of dollars Receivable Payable Beneficiary Guarantor
By industry/counterparty ææææ
"ANK
"ROKERDEALER
-ONOLINE
.ONFINANCIAL
)NSURANCEæANDæOTHERæFINANCIALæINSTITUTIONS
Total by industry/counterparty
By instrument ææææ
#REDITæDEFAULTæSWAPSæANDæOPTIONS
4OTALæRETURNæSWAPSæANDæOTHER
Total by instrument
By rating
)NVESTMENTæGRADE
.ONINVESTMENTæGRADEæ
Total by rating
By maturity
7ITHINææYEAR
&ROMææTOææYEARS
!FTERææYEARS
Total by maturity
æ !LSOæINCLUDESæNOTRATEDæCREDITæDERIVATIVEæINSTRUMENTS