Citibank 2011 Annual Report Download - page 130
Download and view the complete annual report
Please find page 130 of the 2011 Citibank annual report below. You can navigate through the pages in the report by either clicking on the pages listed below, or by using the keyword search tool below to find specific information within the annual report.-
 1
1 -
2
-
3
-
4
-
5
-
6
-
7
-
8
-
9
-
10
-
11
-
12
-
13
-
14
-
15
-
16
-
17
-
18
-
19
-
20
-
21
-
22
-
23
-
24
-
25
-
26
-
27
-
28
-
29
-
30
-
31
-
32
-
33
-
34
-
35
-
36
-
37
-
38
-
39
-
40
-
41
-
42
-
43
-
44
-
45
-
46
-
47
-
48
-
49
-
50
-
51
-
52
-
53
-
54
-
55
-
56
-
57
-
58
-
59
-
60
-
61
-
62
-
63
-
64
-
65
-
66
-
67
-
68
-
69
-
70
-
71
-
72
-
73
-
74
-
75
-
76
-
77
-
78
-
79
-
80
-
81
-
82
-
83
-
84
-
85
-
86
-
87
-
88
-
89
-
90
-
91
-
92
-
93
-
94
-
95
-
96
-
97
-
98
-
99
-
100
-
101
-
102
-
103
-
104
-
105
-
106
-
107
-
108
-
109
-
110
-
111
-
112
-
113
-
114
-
115
-
116
-
117
-
118
-
119
-
 120
120 -
 121
121 -
 122
122 -
 123
123 -
 124
124 -
 125
125 -
 126
126 -
 127
127 -
 128
128 -
 129
129 -
 130
130 -
 131
131 -
 132
132 -
 133
133 -
 134
134 -
 135
135 -
 136
136 -
 137
137 -
 138
138 -
 139
139 -
 140
140 -
141
-
142
-
143
-
144
-
145
-
146
-
147
-
148
-
149
-
150
-
151
-
152
-
153
-
154
-
155
-
156
-
157
-
158
-
159
-
160
-
161
-
162
-
163
-
164
-
165
-
166
-
167
-
168
-
169
-
170
-
171
-
172
-
173
-
174
-
175
-
176
-
177
-
178
-
179
-
180
-
181
-
182
-
183
-
184
-
185
-
186
-
187
-
188
-
189
-
190
-
191
-
192
-
193
-
194
-
195
-
196
-
197
-
198
-
199
-
200
-
201
-
202
-
203
-
204
-
205
-
206
-
207
-
208
-
209
-
210
-
211
-
212
-
213
-
214
-
215
-
216
-
217
-
218
-
219
-
220
-
221
-
222
-
223
-
224
-
225
-
226
-
227
-
228
-
229
-
230
-
231
-
232
-
233
-
234
-
235
-
236
-
237
-
238
-
239
-
240
-
241
-
242
-
243
-
244
-
245
-
246
-
247
-
248
-
249
-
250
-
251
-
252
-
253
-
254
-
255
-
256
-
257
-
258
-
259
-
260
-
261
-
262
-
263
-
264
-
265
-
266
-
267
-
268
-
269
-
270
-
271
-
272
-
273
-
274
-
275
-
276
-
277
-
278
-
279
-
280
-
281
-
282
-
283
-
284
-
285
-
286
-
287
-
288
-
289
-
290
-
291
-
292
-
293
-
294
-
295
-
296
-
297
-
298
-
299
-
300
-
301
-
302
-
303
-
304
-
305
-
306
-
307
-
308
-
309
-
310
-
311
-
312
-
313
-
314
-
315
-
316
-
317
-
318
-
319
-
320
 |
 |
108
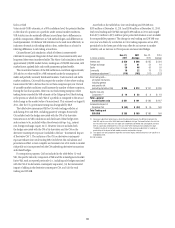
GIIPS
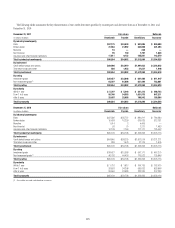
Gross funded credit exposure to the sovereign entities of Greece, Ireland,
Italy, Portugal and Spain (GIIPS), as well as financial institutions and
multinational and local corporations designated in these countries under
Citi’s risk management systems, was $20.2 billion at December 31, 2011. The
$20.2 billion of gross credit exposure was made up of $9.4 billion in funded
loans, before reserves, and $10.8 billion in derivative counterparty mark-to-
market exposure, inclusive of credit valuation adjustments. The derivative
counterparty mark-to-market exposure includes the net credit exposure
arising from secured financing transactions, such as repurchase and reverse
repurchase agreements. See “Secured Financing Transactions” below.
As of December 31, 2011, Citi’s net current funded exposure to the GIIPS
sovereigns, financial institutions and corporations was $7.7 billion. Included
in the $7.7 billion net current funded exposure was $1.3 billion of net trading
and available-for-sale securities exposure, and $6.4 billion of net current
funded credit exposure. Each component is described below in more detail.
Net Trading and AFS Exposure - $1.3 billion
Included in the net current funded exposure at December 31, 2011 was
a net position of $1.3 billion in securities and derivatives with the GIIPS
sovereigns, financial institutions and corporations as the issuer or reference
entity, which are held in Citi’s trading and AFS portfolios. These portfolios are
marked to market daily and, as previously disclosed, Citi’s trading exposure
levels vary as it maintains inventory consistent with customer needs.
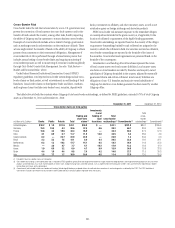
Net Current Funded Credit Exposure - $6.4 billion
As of December 31, 2011, the net current funded credit exposure to the
GIIPS sovereigns, financial institutions and corporations was $6.4 billion.
Exposures were $0.7 billion to sovereigns, $1.6 billion to financial
institutions and $4.1 billion to corporations.
Consistent with Citi’s internal risk management measures and as set forth
in the table above, net current funded credit exposure has been reduced by
$4. billion of margin posted under legally enforceable margin agreements
and collateral pledged under bankruptcy-remote structures. At December 31,
2011, the majority of this margin and collateral was in the form of cash, with
the remainder in predominantly non-GIIPS, non-French securities, which
are included at fair value.
Net current funded credit exposure also reflects a reduction for $9.6 billion
in purchased credit protection, predominantly from financial institutions
outside the GIIPS and France. Such protection generally pays out only
upon the occurrence of certain credit events with respect to the country or
borrower covered by the protection, as determined by a committee composed
of dealers and other market participants. In addition to counterparty credit
risks (see “Credit Default Swaps” below), the credit protection may not fully
cover all situations that may adversely affect the value of Citi’s exposure
and, accordingly, Citi could still experience losses despite the existence of the
credit protection.
Unfunded Commitments—$7.3 billion
As of December 31, 2011, Citi also had $7.3 billion of unfunded
commitments to the GIIPS sovereigns, financial institutions and
corporations, with $6.7 billion of this amount to corporations. These
unfunded lines generally have standard conditions that must be met before
they can be drawn.
Other Activities
Like other banks, Citi also provides settlement and clearing facilities for
a variety of clients in these countries and actively monitors and manages
these intra-day exposures. In addition, at December 31, 2011, Citi had
approximately $7.4 billion of locally funded exposure in the GIIPS, generally
to retail customers and small businesses as part of its local lending activities.
The vast majority of this exposure is in Citi Holdings (Spain and Greece).
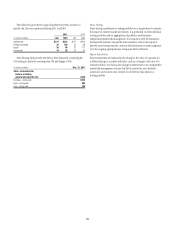
France
Gross funded credit exposure to the French sovereign, financial institutions
and corporations was $11.7 billion at December 31, 2011. The $11.7 billion
of gross credit exposure was made up of $4.7 billion in funded loans,
before reserves, and $7.0 billion in derivative counterparty mark-to-
market exposure, inclusive of credit valuation adjustments. The derivative
counterparty mark-to-market exposure includes the net credit exposure
arising from secured financing transactions, such as repurchase and reverse
repurchase agreements. See “Secured Financing Transactions” below.
As of December 31, 2011, Citi’s net current funded exposure to the French
sovereign, financial institutions and corporations was $1.9 billion. Included
in the $1.9 billion net current funded exposure was $0.6 billion of net trading
and available-for-sale securities exposure, and $1.3 billion of net current
funded credit exposure. Each component is described below in more detail.
Net Trading and AFS Exposure - $0.6 billion
Included in the net current funded exposure at December 31, 2011 was a
net position of $0.6 billion in securities and derivatives with the French
sovereign, financial institutions and corporations as the issuer or reference
entity, which are held in Citi’s trading and AFS portfolios. These portfolios are
marked to market daily and, as previously disclosed, Citi’s trading exposure
levels vary as it maintains inventory consistent with customer needs.
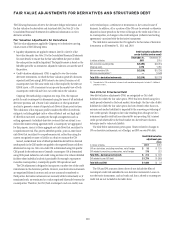
Net Current Funded Credit Exposure - $1.3 billion
As of December 31, 2011, the net current funded credit exposure to the French
sovereign, financial institutions and corporations was $1.3 billion. Exposures
were $1.9 billion to financial institutions and $(0.6) billion to corporations.
Consistent with Citi’s internal risk management measures and as set
forth in the table above, net current funded credit exposure has been
reduced by $5.3 billion of margin posted under legally enforceable margin
agreements and collateral pledged under bankruptcy-remote structures. As
of December 31, 2011, the majority of this margin and collateral was in the
form of cash, with the remainder in non-GIIPS, non-French securities, which
are included at fair value.
2