Citibank 2011 Annual Report Download - page 211
Download and view the complete annual report
Please find page 211 of the 2011 Citibank annual report below. You can navigate through the pages in the report by either clicking on the pages listed below, or by using the keyword search tool below to find specific information within the annual report.-
 1
1 -
2
-
3
-
4
-
5
-
6
-
7
-
8
-
9
-
10
-
11
-
12
-
13
-
14
-
15
-
16
-
17
-
18
-
19
-
20
-
21
-
22
-
23
-
24
-
25
-
26
-
27
-
28
-
29
-
30
-
31
-
32
-
33
-
34
-
35
-
36
-
37
-
38
-
39
-
40
-
41
-
42
-
43
-
44
-
45
-
46
-
47
-
48
-
49
-
50
-
51
-
52
-
53
-
54
-
55
-
56
-
57
-
58
-
59
-
60
-
61
-
62
-
63
-
64
-
65
-
66
-
67
-
68
-
69
-
70
-
71
-
72
-
73
-
74
-
75
-
76
-
77
-
78
-
79
-
80
-
81
-
82
-
83
-
84
-
85
-
86
-
87
-
88
-
89
-
90
-
91
-
92
-
93
-
94
-
95
-
96
-
97
-
98
-
99
-
100
-
101
-
102
-
103
-
104
-
105
-
106
-
107
-
108
-
109
-
110
-
111
-
112
-
113
-
114
-
115
-
116
-
117
-
118
-
119
-
120
-
121
-
122
-
123
-
124
-
125
-
126
-
127
-
128
-
129
-
130
-
131
-
132
-
133
-
134
-
135
-
136
-
137
-
138
-
139
-
140
-
141
-
142
-
143
-
144
-
145
-
146
-
147
-
148
-
149
-
150
-
151
-
152
-
153
-
154
-
155
-
156
-
157
-
158
-
159
-
160
-
161
-
162
-
163
-
164
-
165
-
166
-
167
-
168
-
169
-
170
-
171
-
172
-
173
-
174
-
175
-
176
-
177
-
178
-
179
-
180
-
181
-
182
-
183
-
184
-
185
-
186
-
187
-
188
-
189
-
190
-
191
-
192
-
193
-
194
-
195
-
196
-
197
-
198
-
199
-
200
-
 201
201 -
 202
202 -
 203
203 -
 204
204 -
 205
205 -
 206
206 -
 207
207 -
 208
208 -
 209
209 -
 210
210 -
 211
211 -
 212
212 -
 213
213 -
 214
214 -
 215
215 -
 216
216 -
 217
217 -
 218
218 -
 219
219 -
 220
220 -
 221
221 -
222
-
223
-
224
-
225
-
226
-
227
-
228
-
229
-
230
-
231
-
232
-
233
-
234
-
235
-
236
-
237
-
238
-
239
-
240
-
241
-
242
-
243
-
244
-
245
-
246
-
247
-
248
-
249
-
250
-
251
-
252
-
253
-
254
-
255
-
256
-
257
-
258
-
259
-
260
-
261
-
262
-
263
-
264
-
265
-
266
-
267
-
268
-
269
-
270
-
271
-
272
-
273
-
274
-
275
-
276
-
277
-
278
-
279
-
280
-
281
-
282
-
283
-
284
-
285
-
286
-
287
-
288
-
289
-
290
-
291
-
292
-
293
-
294
-
295
-
296
-
297
-
298
-
299
-
300
-
301
-
302
-
303
-
304
-
305
-
306
-
307
-
308
-
309
-
310
-
311
-
312
-
313
-
314
-
315
-
316
-
317
-
318
-
319
-
320
 |
 |

189
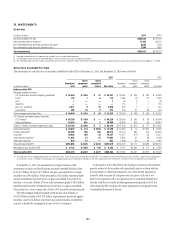
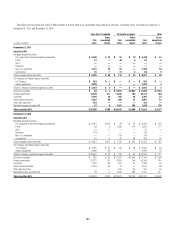
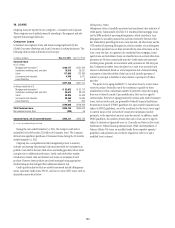
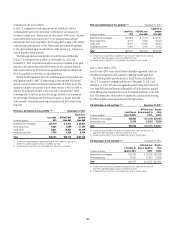
The table below shows the fair value of debt securities in HTM that have been in an unrecognized loss position for less than 12 months or for 12 months or
longer as of December 31, 2011 and December 31, 2010:
Less than 12 months 12 months or longer Total
In millions of dollars
Fair
value
Gross
unrecognized
losses
Fair
value
Gross
unrecognized
losses
Fair
value
Gross
unrecognized
losses
December 31, 2011
Debt securities held-to-maturity
-ORTGAGEBACKEDæSECURITIES $ 735 $ 63 $ 4,827 $ 689 $ 5,562 $ 752
3TATEæANDæMUNICIPAL — — 682 72 682 72
#ORPORATE — — 1,427 254 1,427 254
!SSETBACKEDæSECURITIES 480 71 306 16 786 87
Total debt securities held-to-maturity $ 1,215 $ 134 $ 7,242 $ 1,031 $ 8,457 $ 1,165
December 31, 2010
Debt securities held-to-maturity
-ORTGAGEBACKEDæSECURITIES
3TATEæANDæMUNICIPAL
#ORPORATE
!SSETBACKEDæSECURITIES
Total debt securities held-to-maturity
Excluded from the gross unrecognized losses presented in the above table
are the $2.3 billion and $5.0 billion of gross unrealized losses recorded in
AOCI as of December 31, 2011 and December 31, 2010, respectively, mainly
related to the HTM securities that were reclassified from AFS investments.
Virtually all of these unrecognized losses relate to securities that have been
in a loss position for 12 months or longer at both December 31, 2011 and
December 31, 2010.
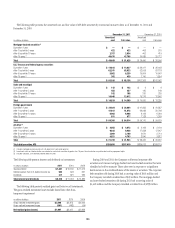
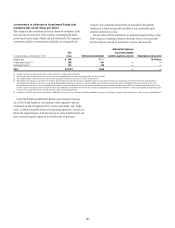
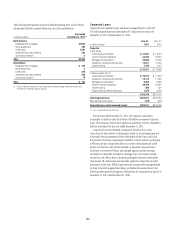
The following table presents the carrying value and fair value of HTM debt securities by contractual maturity dates as of December 31, 2011 and December 31, 2010:
December 31, 2011 $ECEMBERææ
In millions of dollars Carrying value Fair value #ARRYINGæVALUE &AIRæVALUE
Mortgage-backed securities
$UEæWITHINææYEAR $— $—
!FTERææBUTæWITHINææYEARS 275 239
!FTERææBUTæWITHINææYEARS 238 224
!FTERææYEARSæ 6,917 6,320
Total $ 7,430 $ 6,783
State and municipal
$UEæWITHINææYEAR $4 $4
!FTERææBUTæWITHINææYEARS 43 46
!FTERææBUTæWITHINææYEARS 31 30
!FTERææYEARSæ 1,249 1,243
Total $ 1,327 $ 1,323
All other (2)
$UEæWITHINææYEAR $21 $21
!FTERææBUTæWITHINææYEARS 470 438
!FTERææBUTæWITHINææYEARS 1,404 1,182
!FTERææYEARSæ 831 753
Total $ 2,726 $ 2,394
Total debt securities held-to-maturity $ 11,483 $ 10,500
æ )NVESTMENTSæWITHæNOæSTATEDæMATURITIESæAREæINCLUDEDæASæCONTRACTUALæMATURITIESæOFæGREATERæTHANææYEARSæ!CTUALæMATURITIESæMAYæDIFFERæDUEæTOæCALLæORæPREPAYMENTæRIGHTS
æ )NCLUDESæCORPORATEæANDæASSETBACKEDæSECURITIES