Citibank 2011 Annual Report Download - page 153
Download and view the complete annual report
Please find page 153 of the 2011 Citibank annual report below. You can navigate through the pages in the report by either clicking on the pages listed below, or by using the keyword search tool below to find specific information within the annual report.-
 1
1 -
2
-
3
-
4
-
5
-
6
-
7
-
8
-
9
-
10
-
11
-
12
-
13
-
14
-
15
-
16
-
17
-
18
-
19
-
20
-
21
-
22
-
23
-
24
-
25
-
26
-
27
-
28
-
29
-
30
-
31
-
32
-
33
-
34
-
35
-
36
-
37
-
38
-
39
-
40
-
41
-
42
-
43
-
44
-
45
-
46
-
47
-
48
-
49
-
50
-
51
-
52
-
53
-
54
-
55
-
56
-
57
-
58
-
59
-
60
-
61
-
62
-
63
-
64
-
65
-
66
-
67
-
68
-
69
-
70
-
71
-
72
-
73
-
74
-
75
-
76
-
77
-
78
-
79
-
80
-
81
-
82
-
83
-
84
-
85
-
86
-
87
-
88
-
89
-
90
-
91
-
92
-
93
-
94
-
95
-
96
-
97
-
98
-
99
-
100
-
101
-
102
-
103
-
104
-
105
-
106
-
107
-
108
-
109
-
110
-
111
-
112
-
113
-
114
-
115
-
116
-
117
-
118
-
119
-
120
-
121
-
122
-
123
-
124
-
125
-
126
-
127
-
128
-
129
-
130
-
131
-
132
-
133
-
134
-
135
-
136
-
137
-
138
-
139
-
140
-
141
-
142
-
 143
143 -
 144
144 -
 145
145 -
 146
146 -
 147
147 -
 148
148 -
 149
149 -
 150
150 -
 151
151 -
 152
152 -
 153
153 -
 154
154 -
 155
155 -
 156
156 -
 157
157 -
 158
158 -
 159
159 -
 160
160 -
 161
161 -
 162
162 -
 163
163 -
164
-
165
-
166
-
167
-
168
-
169
-
170
-
171
-
172
-
173
-
174
-
175
-
176
-
177
-
178
-
179
-
180
-
181
-
182
-
183
-
184
-
185
-
186
-
187
-
188
-
189
-
190
-
191
-
192
-
193
-
194
-
195
-
196
-
197
-
198
-
199
-
200
-
201
-
202
-
203
-
204
-
205
-
206
-
207
-
208
-
209
-
210
-
211
-
212
-
213
-
214
-
215
-
216
-
217
-
218
-
219
-
220
-
221
-
222
-
223
-
224
-
225
-
226
-
227
-
228
-
229
-
230
-
231
-
232
-
233
-
234
-
235
-
236
-
237
-
238
-
239
-
240
-
241
-
242
-
243
-
244
-
245
-
246
-
247
-
248
-
249
-
250
-
251
-
252
-
253
-
254
-
255
-
256
-
257
-
258
-
259
-
260
-
261
-
262
-
263
-
264
-
265
-
266
-
267
-
268
-
269
-
270
-
271
-
272
-
273
-
274
-
275
-
276
-
277
-
278
-
279
-
280
-
281
-
282
-
283
-
284
-
285
-
286
-
287
-
288
-
289
-
290
-
291
-
292
-
293
-
294
-
295
-
296
-
297
-
298
-
299
-
300
-
301
-
302
-
303
-
304
-
305
-
306
-
307
-
308
-
309
-
310
-
311
-
312
-
313
-
314
-
315
-
316
-
317
-
318
-
319
-
320
 |
 |

131
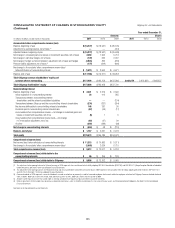
CONSOLIDATED FINANCIAL STATEMENTS
CONSOLIDATED STATEMENT OF INCOME Citigroup Inc. and Subsidiaries
Year ended December 31,
In millions of dollars, except per-share amounts 2011
Revenues
)NTERESTæREVENUE $ 72,681
)NTERESTæEXPENSE 24,234
Net interest revenue $ 48,447
#OMMISSIONSæANDæFEES $ 12,850
0RINCIPALæTRANSACTIONS 7,234
!DMINISTRATIONæANDæOTHERæFIDUCIARYæFEES 3,995
2EALIZEDæGAINSæLOSSESæONæSALESæOFæINVESTMENTSæNET 1,997
/THERTHANTEMPORARYæIMPAIRMENTæLOSSESæONæINVESTMENTS
'ROSSæIMPAIRMENTæLOSSES (2,413)
,ESSæ)MPAIRMENTSæRECOGNIZEDæINæ!/#) 159
.ETæIMPAIRMENTæLOSSESæRECOGNIZEDæINæEARNINGS (2,254)
)NSURANCEæPREMIUMS 2,647
/THERæREVENUE 3,437
Total non-interest revenues $ 29,906
Total revenues, net of interest expense $ 78,353
Provisions for credit losses and for benefits and claims
0ROVISIONæFORæLOANæLOSSES $ 11,773
0OLICYHOLDERæBENEFITSæANDæCLAIMS 972
0ROVISIONæRELEASEæFORæUNFUNDEDæLENDINGæCOMMITMENTS 51
Total provisions for credit losses and for benefits and claims $ 12,796
Operating expenses
#OMPENSATIONæANDæBENEFITS $ 25,688
0REMISESæANDæEQUIPMENT 3,326
4ECHNOLOGYCOMMUNICATION 5,133
!DVERTISINGæANDæMARKETING 2,346
2ESTRUCTURING —
/THERæOPERATING 14,440
Total operating expenses $ 50,933
Income (loss) from continuing operations before income taxes $ 14,624
0ROVISIONæBENEFITæFORæINCOMEæTAXES 3,521
Income (loss) from continuing operations $ 11,103
Discontinued operations
)NCOMEæLOSSæFROMæDISCONTINUEDæOPERATIONS $23
'AINæLOSSæONæSALE 155
0ROVISIONæBENEFITæFORæINCOMEæTAXES 66
Income (loss) from discontinued operations, net of taxes $ 112
Net income (loss) before attribution of noncontrolling interests $ 11,215
.ETæINCOMEæATTRIBUTABLEæTOæNONCONTROLLINGæINTERESTS 148
Citigroup’s net income (loss) $ 11,067
Basic earnings per share (1)(2)
)NCOMEæLOSSæFROMæCONTINUINGæOPERATIONS $ 3.69
)NCOMEæLOSSæFROMæDISCONTINUEDæOPERATIONSæNETæOFæTAXES 0.04
Net income (loss) $ 3.73
Weighted average common shares outstanding 2,909.8
Diluted earnings per share (1)(2)
)NCOMEæLOSSæFROMæCONTINUINGæOPERATIONS $ 3.59
)NCOMEæLOSSæFROMæDISCONTINUEDæOPERATIONSæNETæOFæTAXES 0.04
Net income (loss) $ 3.63
Adjusted weighted average common shares outstanding 2,998.8
æ %ARNINGSæPERæSHAREæAMOUNTSæANDæADJUSTEDæWEIGHTEDæAVERAGEæCOMMONæSHARESæOUTSTANDINGæFORæALLæPERIODSæREFLECTæ#ITIGROUPSæFORæREVERSEæSTOCKæSPLITæWHICHæWASæEFFECTIVEæ-AYææ
æ $UEæTOæTHEæNETæLOSSæAVAILABLEæTOæCOMMONæSHAREHOLDERSæINææLOSSæAVAILABLEæTOæCOMMONæSTOCKHOLDERSæFORæBASICæ%03æWASæUSEDæTOæCALCULATEæDILUTEDæ%03ææ)NCLUDINGæTHEæEFFECTæOFæDILUTIVEæSECURITIESæWOULDæRESULTæINæANTIDILUTION
3EEæ.OTESæTOæTHEæ#ONSOLIDATEDæ&INANCIALæ3TATEMENTS