Citibank 2011 Annual Report Download - page 185
Download and view the complete annual report
Please find page 185 of the 2011 Citibank annual report below. You can navigate through the pages in the report by either clicking on the pages listed below, or by using the keyword search tool below to find specific information within the annual report.-
 1
1 -
2
-
3
-
4
-
5
-
6
-
7
-
8
-
9
-
10
-
11
-
12
-
13
-
14
-
15
-
16
-
17
-
18
-
19
-
20
-
21
-
22
-
23
-
24
-
25
-
26
-
27
-
28
-
29
-
30
-
31
-
32
-
33
-
34
-
35
-
36
-
37
-
38
-
39
-
40
-
41
-
42
-
43
-
44
-
45
-
46
-
47
-
48
-
49
-
50
-
51
-
52
-
53
-
54
-
55
-
56
-
57
-
58
-
59
-
60
-
61
-
62
-
63
-
64
-
65
-
66
-
67
-
68
-
69
-
70
-
71
-
72
-
73
-
74
-
75
-
76
-
77
-
78
-
79
-
80
-
81
-
82
-
83
-
84
-
85
-
86
-
87
-
88
-
89
-
90
-
91
-
92
-
93
-
94
-
95
-
96
-
97
-
98
-
99
-
100
-
101
-
102
-
103
-
104
-
105
-
106
-
107
-
108
-
109
-
110
-
111
-
112
-
113
-
114
-
115
-
116
-
117
-
118
-
119
-
120
-
121
-
122
-
123
-
124
-
125
-
126
-
127
-
128
-
129
-
130
-
131
-
132
-
133
-
134
-
135
-
136
-
137
-
138
-
139
-
140
-
141
-
142
-
143
-
144
-
145
-
146
-
147
-
148
-
149
-
150
-
151
-
152
-
153
-
154
-
155
-
156
-
157
-
158
-
159
-
160
-
161
-
162
-
163
-
164
-
165
-
166
-
167
-
168
-
169
-
170
-
171
-
172
-
173
-
174
-
 175
175 -
 176
176 -
 177
177 -
 178
178 -
 179
179 -
 180
180 -
 181
181 -
 182
182 -
 183
183 -
 184
184 -
 185
185 -
 186
186 -
 187
187 -
 188
188 -
 189
189 -
 190
190 -
 191
191 -
 192
192 -
 193
193 -
 194
194 -
 195
195 -
196
-
197
-
198
-
199
-
200
-
201
-
202
-
203
-
204
-
205
-
206
-
207
-
208
-
209
-
210
-
211
-
212
-
213
-
214
-
215
-
216
-
217
-
218
-
219
-
220
-
221
-
222
-
223
-
224
-
225
-
226
-
227
-
228
-
229
-
230
-
231
-
232
-
233
-
234
-
235
-
236
-
237
-
238
-
239
-
240
-
241
-
242
-
243
-
244
-
245
-
246
-
247
-
248
-
249
-
250
-
251
-
252
-
253
-
254
-
255
-
256
-
257
-
258
-
259
-
260
-
261
-
262
-
263
-
264
-
265
-
266
-
267
-
268
-
269
-
270
-
271
-
272
-
273
-
274
-
275
-
276
-
277
-
278
-
279
-
280
-
281
-
282
-
283
-
284
-
285
-
286
-
287
-
288
-
289
-
290
-
291
-
292
-
293
-
294
-
295
-
296
-
297
-
298
-
299
-
300
-
301
-
302
-
303
-
304
-
305
-
306
-
307
-
308
-
309
-
310
-
311
-
312
-
313
-
314
-
315
-
316
-
317
-
318
-
319
-
320
 |
 |

163
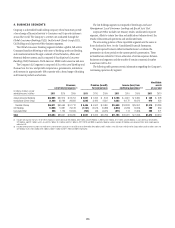
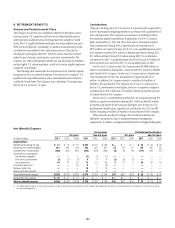
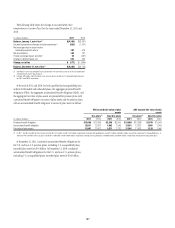
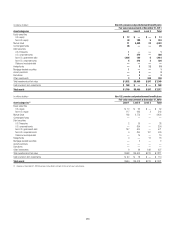
Information with respect to stock option activity under Citigroup stock option programs for the years ended December 31, 2011, 2010 and 2009 is as follows:
2011
Options
Weighted-
average
exercise
price
Intrinsic
value
per share /PTIONS
7EIGHTEDæ
AVERAGEæ
EXERCISEæ
PRICE
)NTRINSICæ
VALUEæ
PERæSHARE /PTIONS
7EIGHTEDæ
AVERAGEæ
EXERCISEæ
PRICE
)NTRINSICæ
VALUEæ
PERæSHARE
Outstanding, beginning of period 37,486,011 $ 93.70 $ —
'RANTEDORIGINAL 3,425,000 48.86 —
&ORFEITEDæORæEXCHANGED (1,539,227) 176.41 —
%XPIRED (1,610,450) 487.24 —
%XERCISED (165,305) 40.80 6.72
Outstanding, end of period 37,596,029 $ 69.60 $ —
Exercisable, end of period 23,237,069
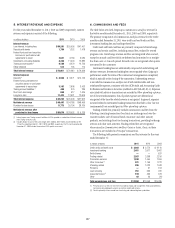
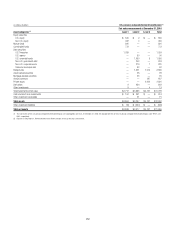
The following table summarizes the information about stock options outstanding under Citigroup stock option programs at December 31, 2011:
Options outstanding Options exercisable
Range of exercise prices
Number
outstanding
Weighted-average
contractual life
remaining
Weighted-average
exercise price
Number
exercisable
Weighted-average
exercise price
n 33,982,017 4.1 years $ 42.38 20,302,484 $ 41.79
n 203,614 9.3 years 56.44 1,807 67.10
n 532,152 6.9 years 147.20 298,788 150.89
n 852,842 2.6 years 244.51 658,586 244.50
n 366,912 3.6 years 346.94 316,912 348.74
n 1,216,690 0.1 years 428.22 1,216,690 428.22
n 441,802 0.3 years 520.90 441,802 520.90
37,596,029 4.0 years $ 69.60 23,237,069 $ 82.47
As of December 31, 2011, there was $122.5 million of total unrecognized compensation cost related to stock options; this cost is expected to be recognized
over a weighted-average period of 0.8 years.