Citibank 2011 Annual Report Download - page 54
Download and view the complete annual report
Please find page 54 of the 2011 Citibank annual report below. You can navigate through the pages in the report by either clicking on the pages listed below, or by using the keyword search tool below to find specific information within the annual report.-
 1
1 -
2
-
3
-
4
-
5
-
6
-
7
-
8
-
9
-
10
-
11
-
12
-
13
-
14
-
15
-
16
-
17
-
18
-
19
-
20
-
21
-
22
-
23
-
24
-
25
-
26
-
27
-
28
-
29
-
30
-
31
-
32
-
33
-
34
-
35
-
36
-
37
-
38
-
39
-
40
-
41
-
42
-
43
-
 44
44 -
 45
45 -
 46
46 -
 47
47 -
 48
48 -
 49
49 -
 50
50 -
 51
51 -
 52
52 -
 53
53 -
 54
54 -
 55
55 -
 56
56 -
 57
57 -
 58
58 -
 59
59 -
 60
60 -
 61
61 -
 62
62 -
 63
63 -
 64
64 -
65
-
66
-
67
-
68
-
69
-
70
-
71
-
72
-
73
-
74
-
75
-
76
-
77
-
78
-
79
-
80
-
81
-
82
-
83
-
84
-
85
-
86
-
87
-
88
-
89
-
90
-
91
-
92
-
93
-
94
-
95
-
96
-
97
-
98
-
99
-
100
-
101
-
102
-
103
-
104
-
105
-
106
-
107
-
108
-
109
-
110
-
111
-
112
-
113
-
114
-
115
-
116
-
117
-
118
-
119
-
120
-
121
-
122
-
123
-
124
-
125
-
126
-
127
-
128
-
129
-
130
-
131
-
132
-
133
-
134
-
135
-
136
-
137
-
138
-
139
-
140
-
141
-
142
-
143
-
144
-
145
-
146
-
147
-
148
-
149
-
150
-
151
-
152
-
153
-
154
-
155
-
156
-
157
-
158
-
159
-
160
-
161
-
162
-
163
-
164
-
165
-
166
-
167
-
168
-
169
-
170
-
171
-
172
-
173
-
174
-
175
-
176
-
177
-
178
-
179
-
180
-
181
-
182
-
183
-
184
-
185
-
186
-
187
-
188
-
189
-
190
-
191
-
192
-
193
-
194
-
195
-
196
-
197
-
198
-
199
-
200
-
201
-
202
-
203
-
204
-
205
-
206
-
207
-
208
-
209
-
210
-
211
-
212
-
213
-
214
-
215
-
216
-
217
-
218
-
219
-
220
-
221
-
222
-
223
-
224
-
225
-
226
-
227
-
228
-
229
-
230
-
231
-
232
-
233
-
234
-
235
-
236
-
237
-
238
-
239
-
240
-
241
-
242
-
243
-
244
-
245
-
246
-
247
-
248
-
249
-
250
-
251
-
252
-
253
-
254
-
255
-
256
-
257
-
258
-
259
-
260
-
261
-
262
-
263
-
264
-
265
-
266
-
267
-
268
-
269
-
270
-
271
-
272
-
273
-
274
-
275
-
276
-
277
-
278
-
279
-
280
-
281
-
282
-
283
-
284
-
285
-
286
-
287
-
288
-
289
-
290
-
291
-
292
-
293
-
294
-
295
-
296
-
297
-
298
-
299
-
300
-
301
-
302
-
303
-
304
-
305
-
306
-
307
-
308
-
309
-
310
-
311
-
312
-
313
-
314
-
315
-
316
-
317
-
318
-
319
-
320
 |
 |

32
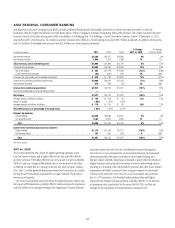
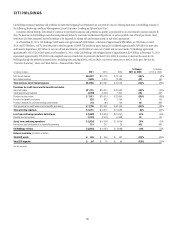
LOCAL CONSUMER LENDING
As of December 31, 2011, Local Consumer Lending (LCL) included a portion of Citigroup’s North America mortgage business, retail partner cards,
CitiFinancial North America (consisting of the OneMain and CitiFinancial Servicing businesses), remaining student loans, and other local Consumer finance
businesses globally (including Western European cards and retail banking and Japan Consumer Finance). At December 31, 2011, LCL had approximately $201
billion of assets (approximately $186 billion in North America) or approximately 75% of Citi Holdings assets. The North America assets consisted of residential
mortgages (residential first mortgages and home equity loans), retail partner card loans, personal loans, commercial real estate, and other consumer loans and
assets. As referenced under “Citi Holdings” above, the substantial majority of the retail partner cards business will be transferred to Citicorp—NA RCB, effective
in the first quarter of 2012.
As of December 31, 2011, approximately $108 billion of assets in LCL consisted of North America mortgages in Citi’s CitiMortgage and CitiFinancial operations.
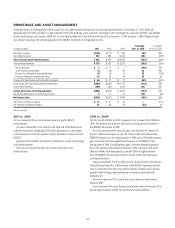
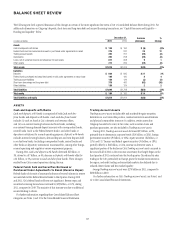
In millions of dollars 2011
% Change
2011 vs. 2010
æ#HANGEæ
æVSæ
.ETæINTERESTæREVENUE $10,872 (21)%
.ONINTERESTæREVENUE 1,195 (40)
Total revenues, net of interest expense $12,067 (24)%
4OTALæOPERATINGæEXPENSES $ 7,769 (4)%
.ETæCREDITæLOSSES $10,659 (37)%
#REDITæRESERVEæBUILDæRELEASE (2,862) (62) .-
0ROVISIONæFORæBENEFITSæANDæCLAIMS 772 —
0ROVISIONæFORæUNFUNDEDæLENDINGæCOMMITMENTS — —
0ROVISIONSæFORæCREDITæLOSSESæANDæFORæBENEFITSæANDæCLAIMS $ 8,569 (47)%
,OSSæFROMæCONTINUINGæOPERATIONSæBEFOREæTAXES $ (4,271) 48%
"ENEFITSæFORæINCOMEæTAXES (1,437) 56
(Loss) from continuing operations $ (2,834) 43%
.ETæINCOMEæATTRIBUTABLEæTOæNONCONTROLLINGæINTERESTS 2 (75)
Net (loss) $ (2,836) 43%
!VERAGEæASSETSæ(in billions of dollars) $ 228 (30)%
Net credit losses as a percentage of average loans 5.34%
Total GAAP revenues $12,067 (24)%
æ.ETæIMPACTæOFæCREDITæCARDæSECURITIZATIONSæACTIVITYæ —
Total managed revenues $12,067 (24)%
Total GAAP net credit losses $10,659 (37)%
æ)MPACTæOFæCREDITæCARDæSECURITIZATIONSæACTIVITYæ —
Total managed net credit losses $10,659 (37)%
ææ 3EEæ.OTEææTOæTHEæ#ONSOLIDATEDæ&INANCIALæ3TATEMENTSæFORæAæDISCUSSIONæOFæTHEæIMPACTæOFæ3&!3æ
.-æ .OTæMEANINGFUL
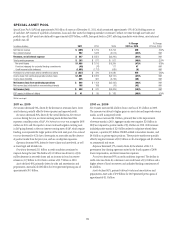
2011 vs. 2010
Net loss decreased 43%, driven primarily by the improving credit environment,
including lower net credit losses and higher loan loss reserve releases, in both
retail partner cards and mortgages. The improvement in credit was partly
offset by lower revenues due to decreasing asset balances and sales.
Revenues decreased 24%, driven primarily by the lower asset balances
due to asset sales, divestitures and run-offs, which also drove the 21% decline
in Net interest revenue. Non-interest revenue decreased 40% due to the
impact of divestitures.
Expenses decreased 4%, driven by the lower volumes and divestitures,
partly offset by higher legal and regulatory expenses, including without
limitation those relating to the United States and state attorneys general
mortgage servicing discussions and agreement in principle announced on
February 9, 2012, reserves related to potential PPI refunds (see “Payment
Protection Insurance” below) and, to a lesser extent, implementation costs
associated with the OCC/Federal Reserve Board consent orders entered into in
April 2011.
Provisions decreased 47%, driven by lower credit losses and higher loan
loss reserve releases. Net credit losses decreased 37%, primarily due to the
credit improvements in retail partner cards ($3.0 billion) and North America
mortgages ($1.6 billion), although the pace of the decline in net credit losses
in both portfolios slowed. Loan loss reserve releases increased 62%, driven by
higher releases in retail partner cards and CitiFinancial North America due to
better credit quality and lower loan balances.
Assets declined 20% from the prior year, primarily driven by portfolio run-
off and the impact of asset sales and divestitures, including continued sales
of student loans, auto loans and delinquent mortgages (see “North America
Consumer Mortgage Lending” below).