Citibank 2011 Annual Report Download - page 45
Download and view the complete annual report
Please find page 45 of the 2011 Citibank annual report below. You can navigate through the pages in the report by either clicking on the pages listed below, or by using the keyword search tool below to find specific information within the annual report.-
 1
1 -
2
-
3
-
4
-
5
-
6
-
7
-
8
-
9
-
10
-
11
-
12
-
13
-
14
-
15
-
16
-
17
-
18
-
19
-
20
-
21
-
22
-
23
-
24
-
25
-
26
-
27
-
28
-
29
-
30
-
31
-
32
-
33
-
34
-
 35
35 -
 36
36 -
 37
37 -
 38
38 -
 39
39 -
 40
40 -
 41
41 -
 42
42 -
 43
43 -
 44
44 -
 45
45 -
 46
46 -
 47
47 -
 48
48 -
 49
49 -
 50
50 -
 51
51 -
 52
52 -
 53
53 -
 54
54 -
 55
55 -
56
-
57
-
58
-
59
-
60
-
61
-
62
-
63
-
64
-
65
-
66
-
67
-
68
-
69
-
70
-
71
-
72
-
73
-
74
-
75
-
76
-
77
-
78
-
79
-
80
-
81
-
82
-
83
-
84
-
85
-
86
-
87
-
88
-
89
-
90
-
91
-
92
-
93
-
94
-
95
-
96
-
97
-
98
-
99
-
100
-
101
-
102
-
103
-
104
-
105
-
106
-
107
-
108
-
109
-
110
-
111
-
112
-
113
-
114
-
115
-
116
-
117
-
118
-
119
-
120
-
121
-
122
-
123
-
124
-
125
-
126
-
127
-
128
-
129
-
130
-
131
-
132
-
133
-
134
-
135
-
136
-
137
-
138
-
139
-
140
-
141
-
142
-
143
-
144
-
145
-
146
-
147
-
148
-
149
-
150
-
151
-
152
-
153
-
154
-
155
-
156
-
157
-
158
-
159
-
160
-
161
-
162
-
163
-
164
-
165
-
166
-
167
-
168
-
169
-
170
-
171
-
172
-
173
-
174
-
175
-
176
-
177
-
178
-
179
-
180
-
181
-
182
-
183
-
184
-
185
-
186
-
187
-
188
-
189
-
190
-
191
-
192
-
193
-
194
-
195
-
196
-
197
-
198
-
199
-
200
-
201
-
202
-
203
-
204
-
205
-
206
-
207
-
208
-
209
-
210
-
211
-
212
-
213
-
214
-
215
-
216
-
217
-
218
-
219
-
220
-
221
-
222
-
223
-
224
-
225
-
226
-
227
-
228
-
229
-
230
-
231
-
232
-
233
-
234
-
235
-
236
-
237
-
238
-
239
-
240
-
241
-
242
-
243
-
244
-
245
-
246
-
247
-
248
-
249
-
250
-
251
-
252
-
253
-
254
-
255
-
256
-
257
-
258
-
259
-
260
-
261
-
262
-
263
-
264
-
265
-
266
-
267
-
268
-
269
-
270
-
271
-
272
-
273
-
274
-
275
-
276
-
277
-
278
-
279
-
280
-
281
-
282
-
283
-
284
-
285
-
286
-
287
-
288
-
289
-
290
-
291
-
292
-
293
-
294
-
295
-
296
-
297
-
298
-
299
-
300
-
301
-
302
-
303
-
304
-
305
-
306
-
307
-
308
-
309
-
310
-
311
-
312
-
313
-
314
-
315
-
316
-
317
-
318
-
319
-
320
 |
 |
23
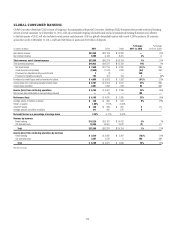
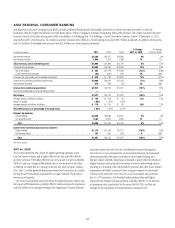
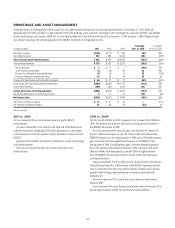
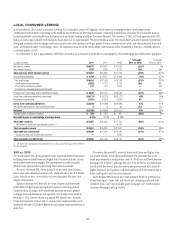
Expenses increased 13% due to continued investment spending, growth
in business volumes, repositioning charges and higher legal and related
expenses, as well as the impact of FX translation, partially offset by ongoing
productivity savings. The increase in the level of incremental investment
spending in the business was largely completed at the end of 2011.
Provisions increased 13% as lower loan loss reserve releases were partially
offset by lower net credit losses. The increase in credit provisions reflected the
increasing volumes in the region, partially offset by continued credit quality
improvement. India remained a significant driver of the improvement in
credit quality, as it continued to de-risk elements of its legacy portfolio. Citi
believes that provisions could continue to increase as the portfolio continues
to grow and season.
2010 vs. 2009
Net income increased 53%, driven by growth in revenue and a decrease
in provisions, partially offset by higher operating expenses and a higher
effective tax rate. During 2010, the U.S. dollar generally depreciated versus
local currencies. As a result, the impact of FX translation accounted for
approximately 6% growth in revenues, and 7% growth in expenses.
Revenues increased 10%, driven by higher business volumes and the
impact of FX translation, partially offset by spread compression. Net interest
revenue increased 6%, as investment initiatives and sustained economic
growth in the region drove higher lending and deposit volumes, which were
partly offset by the spread compression. Non-interest revenue increased
20%, primarily due to higher investment sales and a 19% increase in Citi-
branded cards purchase sales.
Expenses increased 13%, due to growth in business volumes, investment
spending and the impact of FX translation.
Provisions decreased 61%, mainly due to the net impact of a loan loss
reserve release of $287 million in 2010, compared to a $523 million loan loss
reserve build in 2009 and a 24% decline in net credit losses. The decrease in
provisions reflected continued credit quality improvement across the region,
particularly in India, partially offset by the increasing volumes in the region.