Citibank 2011 Annual Report Download - page 177
Download and view the complete annual report
Please find page 177 of the 2011 Citibank annual report below. You can navigate through the pages in the report by either clicking on the pages listed below, or by using the keyword search tool below to find specific information within the annual report.-
 1
1 -
2
-
3
-
4
-
5
-
6
-
7
-
8
-
9
-
10
-
11
-
12
-
13
-
14
-
15
-
16
-
17
-
18
-
19
-
20
-
21
-
22
-
23
-
24
-
25
-
26
-
27
-
28
-
29
-
30
-
31
-
32
-
33
-
34
-
35
-
36
-
37
-
38
-
39
-
40
-
41
-
42
-
43
-
44
-
45
-
46
-
47
-
48
-
49
-
50
-
51
-
52
-
53
-
54
-
55
-
56
-
57
-
58
-
59
-
60
-
61
-
62
-
63
-
64
-
65
-
66
-
67
-
68
-
69
-
70
-
71
-
72
-
73
-
74
-
75
-
76
-
77
-
78
-
79
-
80
-
81
-
82
-
83
-
84
-
85
-
86
-
87
-
88
-
89
-
90
-
91
-
92
-
93
-
94
-
95
-
96
-
97
-
98
-
99
-
100
-
101
-
102
-
103
-
104
-
105
-
106
-
107
-
108
-
109
-
110
-
111
-
112
-
113
-
114
-
115
-
116
-
117
-
118
-
119
-
120
-
121
-
122
-
123
-
124
-
125
-
126
-
127
-
128
-
129
-
130
-
131
-
132
-
133
-
134
-
135
-
136
-
137
-
138
-
139
-
140
-
141
-
142
-
143
-
144
-
145
-
146
-
147
-
148
-
149
-
150
-
151
-
152
-
153
-
154
-
155
-
156
-
157
-
158
-
159
-
160
-
161
-
162
-
163
-
164
-
165
-
166
-
 167
167 -
 168
168 -
 169
169 -
 170
170 -
 171
171 -
 172
172 -
 173
173 -
 174
174 -
 175
175 -
 176
176 -
 177
177 -
 178
178 -
 179
179 -
 180
180 -
 181
181 -
 182
182 -
 183
183 -
 184
184 -
 185
185 -
 186
186 -
 187
187 -
188
-
189
-
190
-
191
-
192
-
193
-
194
-
195
-
196
-
197
-
198
-
199
-
200
-
201
-
202
-
203
-
204
-
205
-
206
-
207
-
208
-
209
-
210
-
211
-
212
-
213
-
214
-
215
-
216
-
217
-
218
-
219
-
220
-
221
-
222
-
223
-
224
-
225
-
226
-
227
-
228
-
229
-
230
-
231
-
232
-
233
-
234
-
235
-
236
-
237
-
238
-
239
-
240
-
241
-
242
-
243
-
244
-
245
-
246
-
247
-
248
-
249
-
250
-
251
-
252
-
253
-
254
-
255
-
256
-
257
-
258
-
259
-
260
-
261
-
262
-
263
-
264
-
265
-
266
-
267
-
268
-
269
-
270
-
271
-
272
-
273
-
274
-
275
-
276
-
277
-
278
-
279
-
280
-
281
-
282
-
283
-
284
-
285
-
286
-
287
-
288
-
289
-
290
-
291
-
292
-
293
-
294
-
295
-
296
-
297
-
298
-
299
-
300
-
301
-
302
-
303
-
304
-
305
-
306
-
307
-
308
-
309
-
310
-
311
-
312
-
313
-
314
-
315
-
316
-
317
-
318
-
319
-
320
 |
 |

155
Sale of Nikko Cordial
On October 1, 2009 the Company announced the successful completion
of the sale of Nikko Cordial Securities to Sumitomo Mitsui Banking
Corporation. The transaction had a total cash value to Citi of 776 billion
yen (U.S. $8.7 billion at an exchange rate of 89.60 yen to U.S. $1.00 as of
September 30, 2009). The cash value was composed of the purchase price
for the transferred business of 545 billion yen, the purchase price for certain
Japanese-listed equity securities held by Nikko Cordial Securities of 30 billion
yen, and 201 billion yen of excess cash derived through the repayment of
outstanding indebtedness to Citi. After considering the impact of foreign
exchange hedges of the proceeds of the transaction, the sale resulted in an
immaterial gain in 2009. A total of about 7,800 employees were included in
the transaction.
The Nikko Cordial operations had total assets and total liabilities of
approximately $24 billion and $16 billion, respectively, at the time of sale,
which were reflected in Citi Holdings prior to the sale.
Results for all of the Nikko Cordial businesses sold are reported as
Discontinued operations for all periods presented.
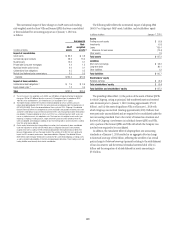
Summarized financial information for Discontinued operations,
including cash flows, related to the sale of Nikko Cordial is as follows:
In millions of dollars 2011
Total revenues, net of interest expense (1) $—
,OSSæFROMæDISCONTINUEDæOPERATIONS $—
'AINæONæSALE —
"ENEFITæFORæINCOMEæTAXES —
Income (loss) from discontinued
operations, net of taxes $—
In millions of dollars 2011
#ASHæFLOWSæFROMæOPERATINGæACTIVITIES $—
#ASHæFLOWSæFROMæINVESTINGæACTIVITIES —
#ASHæFLOWSæFROMæFINANCINGæACTIVITIES —
Net cash provided by (used in)
discontinued operations $—
æ 4OTALæREVENUESæINCLUDEæGAINæORæLOSSæONæSALEæIFæAPPLICABLE
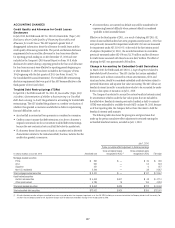
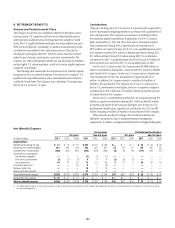
Combined Results for Discontinued Operations
The following is summarized financial information for the Egg credit
card, SLC, Nikko Cordial Securities, German retail banking and CitiCapital
businesses. The SLC business, which was sold on December 31, 2010, is
reported as discontinued operations for the third and fourth quarters of 2010
only and the sale of the Egg credit card business is reported as discontinued
operations for the full year 2011 only due to the immateriality of the impact
of that presentation in other periods. The Nikko Cordial Securities business,
which was sold on October 1, 2009, the German retail banking business,
which was sold on December 5, 2008, and the CitiCapital business, which
was sold on July 31, 2008, continue to have minimal residual costs associated
with the sales. Additionally, during 2009, contingent consideration payments
of $29 million pretax ($19 million after tax) were received related to the sale
of Citigroup’s asset management business, which was sold in December 2005.
In millions of dollars 2011
Total revenues, net of interest
expense (1) $ 352
)NCOMEæLOSSæFROMæDISCONTINUEDæ
OPERATIONS $23
'AINæLOSSæONæSALE 155
0ROVISIONæBENEFITæFORæINCOMEæTAXESæ 66
Income (loss) from discontinued
operations, net of taxes $ 112
In millions of dollars 2011
#ASHæFLOWSæFROMæOPERATINGæACTIVITIES $ (146)
#ASHæFLOWSæFROMæINVESTINGæACTIVITIES 2,827
#ASHæFLOWSæFROMæFINANCINGæACTIVITIES (12)
Net cash provided by discontinued
operations $2,669
æ 4OTALæREVENUESæINCLUDEæGAINæORæLOSSæONæSALEæIFæAPPLICABLE