Citibank 2011 Annual Report Download - page 120
Download and view the complete annual report
Please find page 120 of the 2011 Citibank annual report below. You can navigate through the pages in the report by either clicking on the pages listed below, or by using the keyword search tool below to find specific information within the annual report.-
 1
1 -
2
-
3
-
4
-
5
-
6
-
7
-
8
-
9
-
10
-
11
-
12
-
13
-
14
-
15
-
16
-
17
-
18
-
19
-
20
-
21
-
22
-
23
-
24
-
25
-
26
-
27
-
28
-
29
-
30
-
31
-
32
-
33
-
34
-
35
-
36
-
37
-
38
-
39
-
40
-
41
-
42
-
43
-
44
-
45
-
46
-
47
-
48
-
49
-
50
-
51
-
52
-
53
-
54
-
55
-
56
-
57
-
58
-
59
-
60
-
61
-
62
-
63
-
64
-
65
-
66
-
67
-
68
-
69
-
70
-
71
-
72
-
73
-
74
-
75
-
76
-
77
-
78
-
79
-
80
-
81
-
82
-
83
-
84
-
85
-
86
-
87
-
88
-
89
-
90
-
91
-
92
-
93
-
94
-
95
-
96
-
97
-
98
-
99
-
100
-
101
-
102
-
103
-
104
-
105
-
106
-
107
-
108
-
109
-
 110
110 -
 111
111 -
 112
112 -
 113
113 -
 114
114 -
 115
115 -
 116
116 -
 117
117 -
 118
118 -
 119
119 -
 120
120 -
 121
121 -
 122
122 -
 123
123 -
 124
124 -
 125
125 -
 126
126 -
 127
127 -
 128
128 -
 129
129 -
 130
130 -
131
-
132
-
133
-
134
-
135
-
136
-
137
-
138
-
139
-
140
-
141
-
142
-
143
-
144
-
145
-
146
-
147
-
148
-
149
-
150
-
151
-
152
-
153
-
154
-
155
-
156
-
157
-
158
-
159
-
160
-
161
-
162
-
163
-
164
-
165
-
166
-
167
-
168
-
169
-
170
-
171
-
172
-
173
-
174
-
175
-
176
-
177
-
178
-
179
-
180
-
181
-
182
-
183
-
184
-
185
-
186
-
187
-
188
-
189
-
190
-
191
-
192
-
193
-
194
-
195
-
196
-
197
-
198
-
199
-
200
-
201
-
202
-
203
-
204
-
205
-
206
-
207
-
208
-
209
-
210
-
211
-
212
-
213
-
214
-
215
-
216
-
217
-
218
-
219
-
220
-
221
-
222
-
223
-
224
-
225
-
226
-
227
-
228
-
229
-
230
-
231
-
232
-
233
-
234
-
235
-
236
-
237
-
238
-
239
-
240
-
241
-
242
-
243
-
244
-
245
-
246
-
247
-
248
-
249
-
250
-
251
-
252
-
253
-
254
-
255
-
256
-
257
-
258
-
259
-
260
-
261
-
262
-
263
-
264
-
265
-
266
-
267
-
268
-
269
-
270
-
271
-
272
-
273
-
274
-
275
-
276
-
277
-
278
-
279
-
280
-
281
-
282
-
283
-
284
-
285
-
286
-
287
-
288
-
289
-
290
-
291
-
292
-
293
-
294
-
295
-
296
-
297
-
298
-
299
-
300
-
301
-
302
-
303
-
304
-
305
-
306
-
307
-
308
-
309
-
310
-
311
-
312
-
313
-
314
-
315
-
316
-
317
-
318
-
319
-
320
 |
 |

98
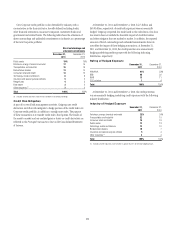
Value at Risk
Value at risk (VAR) estimates, at a 99% confidence level, the potential decline
in the value of a position or a portfolio under normal market conditions.
VAR statistics can be materially different across firms due to differences in
portfolio composition, differences in VAR methodologies, and differences in
model parameters. Citi believes VAR statistics can be used more effectively as
indicators of trends in risk taking within a firm, rather than as a basis for
inferring differences in risk taking across firms.
Citi uses Monte Carlo simulation, which it believes is conservatively
calibrated to incorporate the greater of short-term (most recent month) and
long-term (three years) market volatility. The Monte Carlo simulation involves
approximately 300,000 market factors, making use of 180,000 time series, with
market factors updated daily and model parameters updated weekly.
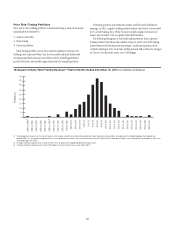
The conservative features of the VAR calibration contribute approximately
20% add-on to what would be a VAR estimated under the assumption of
stable and perfectly normally distributed markets. Under normal and stable
market conditions, Citi would thus expect the number of days where trading
losses exceed its VAR to be less than two or three exceptions per year. Periods
of unstable market conditions could increase the number of these exceptions.
During the last four quarters, there was one back-testing exception where
trading losses exceeded the VAR estimate at the Citigroup level (back-testing
is the process in which the daily VAR of a portfolio is compared to the actual
daily change in the market value of transactions). This occurred on August 8,
2011, after the U.S. government rating was downgraded by S&P.
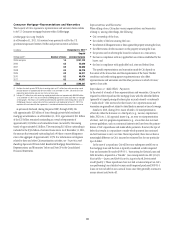
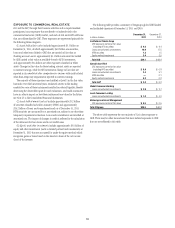
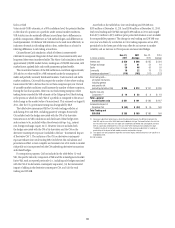
The table below summarizes VAR for Citi-wide trading portfolios at
and during 2011 and 2010, including quarterly averages. Historically,
Citi included only the hedges associated with the CVA of its derivative
transactions in its VAR calculations and disclosures (these hedges were,
and continue to be, included within the relevant risk type (e.g., interest
rate, foreign exchange, equity, etc.)). However, Citi now includes both
the hedges associated with the CVA of its derivatives and the CVA on the
derivative counterparty exposure (included in the line “Incremental Impact
of Derivative CVA”). The inclusion of the CVA on derivative counterparty
exposure reduces Citi’s total trading VAR; Citi believes this calculation and
presentation reflect a more complete and accurate view of its mark-to-market
risk profile as it incorporates both the CVA underlying derivative transactions
and related hedges.
For comparison purposes, Citi has included in the table below (i) total
VAR, the specific risk-only component of VAR and the isolated general market
factor VAR, each as reported previously (i.e., including only hedges associated
with the CVA of its derivatives counterparty exposures), (ii) the incremental
impact of adding in the derivative counterparty CVA, and (iii) the total
trading and CVA VAR.
As set forth in the table below, Citi’s total trading and CVA VAR was
$183 million at December 31, 2011 and $186 million at December 31, 2010.
Daily total trading and CVA VAR averaged $189 million in 2011 and ranged
from $135 million to $255 million (prior period information is not available
for comparability purposes). The change in total trading and CVA VAR year
over year was driven by a reduction in Citi’s trading exposures across S&B,
particularly in the latter part of the year, offset by an increase in market
volatility and an increase in CVA exposures and associated hedges.
In millions of dollars
Dec. 31,
2011
2011
Average
$ECææ
æ
!VERAGE
)NTERESTæRATE $ 250 $ 246
&OREIGNæEXCHANGE 51 61
%QUITY 36 46
#OMMODITY 16 22
#OVARIANCEæADJUSTMENTæ (118) (162)
4OTALæ4RADINGæ6!2æ
ALLæMARKETæRISKæFACTORSæ
INCLUDINGæGENERALæ
ANDæSPECIFICæRISKæ
EXCLUDINGæDERIVATIVEæ#6! $ 235 $ 213
3PECIFICæRISKONLYæ
#OMPONENTæ $14 $22
Total—general
market factors only $ 221 $ 191
)NCREMENTALæ)MPACTæOFæ
$ERIVATIVEæ#6! $ (52) $ (24) .!
Total Trading and
CVA VAR $ 183 $ 189 .!
æ #OVARIANCEæADJUSTMENTæALSOæKNOWNæASæDIVERSIFICATIONæBENEFITæEQUALSæTHEæDIFFERENCEæBETWEENæTHEæ
TOTALæ6!2æANDæTHEæSUMæOFæTHEæ6!2SæTIEDæTOæEACHæINDIVIDUALæRISKæTYPEæ4HEæBENEFITæREFLECTSæTHEæFACTæTHATæ
THEæRISKSæWITHINæEACHæANDæACROSSæRISKæTYPESæAREæNOTæPERFECTLYæCORRELATEDæANDæCONSEQUENTLYæTHEæTOTALæ
6!2æONæAæGIVENæDAYæWILLæBEæLOWERæTHANæTHEæSUMæOFæTHEæ6!2SæRELATINGæTOæEACHæINDIVIDUALæRISKæTYPEæ
4HEæDETERMINATIONæOFæTHEæPRIMARYæDRIVERSæOFæCHANGESæTOæTHEæCOVARIANCEæADJUSTMENTæISæMADEæBYæANæ
EXAMINATIONæOFæTHEæIMPACTæOFæBOTHæMODELæPARAMETERæANDæPOSITIONæCHANGES
æ 4HEæSPECIFICæRISKONLYæCOMPONENTæREPRESENTSæTHEæLEVELæOFæEQUITYæANDæFIXEDæINCOMEæISSUERSPECIFICæRISKæ
EMBEDDEDæINæ6!2
.!æ .OTæAVAILABLE