Citibank 2011 Annual Report Download - page 50
Download and view the complete annual report
Please find page 50 of the 2011 Citibank annual report below. You can navigate through the pages in the report by either clicking on the pages listed below, or by using the keyword search tool below to find specific information within the annual report.-
 1
1 -
2
-
3
-
4
-
5
-
6
-
7
-
8
-
9
-
10
-
11
-
12
-
13
-
14
-
15
-
16
-
17
-
18
-
19
-
20
-
21
-
22
-
23
-
24
-
25
-
26
-
27
-
28
-
29
-
30
-
31
-
32
-
33
-
34
-
35
-
36
-
37
-
38
-
39
-
 40
40 -
 41
41 -
 42
42 -
 43
43 -
 44
44 -
 45
45 -
 46
46 -
 47
47 -
 48
48 -
 49
49 -
 50
50 -
 51
51 -
 52
52 -
 53
53 -
 54
54 -
 55
55 -
 56
56 -
 57
57 -
 58
58 -
 59
59 -
 60
60 -
61
-
62
-
63
-
64
-
65
-
66
-
67
-
68
-
69
-
70
-
71
-
72
-
73
-
74
-
75
-
76
-
77
-
78
-
79
-
80
-
81
-
82
-
83
-
84
-
85
-
86
-
87
-
88
-
89
-
90
-
91
-
92
-
93
-
94
-
95
-
96
-
97
-
98
-
99
-
100
-
101
-
102
-
103
-
104
-
105
-
106
-
107
-
108
-
109
-
110
-
111
-
112
-
113
-
114
-
115
-
116
-
117
-
118
-
119
-
120
-
121
-
122
-
123
-
124
-
125
-
126
-
127
-
128
-
129
-
130
-
131
-
132
-
133
-
134
-
135
-
136
-
137
-
138
-
139
-
140
-
141
-
142
-
143
-
144
-
145
-
146
-
147
-
148
-
149
-
150
-
151
-
152
-
153
-
154
-
155
-
156
-
157
-
158
-
159
-
160
-
161
-
162
-
163
-
164
-
165
-
166
-
167
-
168
-
169
-
170
-
171
-
172
-
173
-
174
-
175
-
176
-
177
-
178
-
179
-
180
-
181
-
182
-
183
-
184
-
185
-
186
-
187
-
188
-
189
-
190
-
191
-
192
-
193
-
194
-
195
-
196
-
197
-
198
-
199
-
200
-
201
-
202
-
203
-
204
-
205
-
206
-
207
-
208
-
209
-
210
-
211
-
212
-
213
-
214
-
215
-
216
-
217
-
218
-
219
-
220
-
221
-
222
-
223
-
224
-
225
-
226
-
227
-
228
-
229
-
230
-
231
-
232
-
233
-
234
-
235
-
236
-
237
-
238
-
239
-
240
-
241
-
242
-
243
-
244
-
245
-
246
-
247
-
248
-
249
-
250
-
251
-
252
-
253
-
254
-
255
-
256
-
257
-
258
-
259
-
260
-
261
-
262
-
263
-
264
-
265
-
266
-
267
-
268
-
269
-
270
-
271
-
272
-
273
-
274
-
275
-
276
-
277
-
278
-
279
-
280
-
281
-
282
-
283
-
284
-
285
-
286
-
287
-
288
-
289
-
290
-
291
-
292
-
293
-
294
-
295
-
296
-
297
-
298
-
299
-
300
-
301
-
302
-
303
-
304
-
305
-
306
-
307
-
308
-
309
-
310
-
311
-
312
-
313
-
314
-
315
-
316
-
317
-
318
-
319
-
320
 |
 |

28
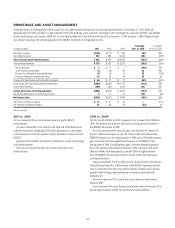
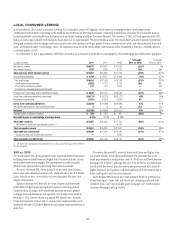
TRANSACTION SERVICES
Transaction Services is composed of Treasury and Trade Solutions and Securities and Fund Services. Treasury and Trade Solutions provides comprehensive
cash management and trade finance and services for corporations, financial institutions and public sector entities worldwide. Securities and Fund Services
provides securities services to investors, such as global asset managers, custody and clearing services to intermediaries such as broker-dealers, and depository and
agency/trust services to multinational corporations and governments globally. Revenue is generated from net interest revenue on deposits in these businesses, as
well as from trade loans and fees for transaction processing and fees on assets under custody and administration in Securities and Fund Services.
In millions of dollars 2011
% Change
2011 vs. 2010
æ#HANGEæ
æVSæ
.ETæINTERESTæREVENUE $ 5,929 4%
.ONINTERESTæREVENUE 4,640 6
Total revenues, net of interest expense $10,569 5%
4OTALæOPERATINGæEXPENSES 5,659 15
0ROVISIONSæRELEASESæFORæCREDITæLOSSESæANDæFORæBENEFITSæANDæCLAIMS 36 NM .-
Income before taxes and noncontrolling interests $ 4,874 (7)%
)NCOMEæTAXES 1,467 (5)
)NCOMEæFROMæCONTINUINGæOPERATIONS 3,407 (7)
.ETæINCOMEæATTRIBUTABLEæTOæNONCONTROLLINGæINTERESTS 19 (10)
Net income $ 3,388 (7)%
!VERAGEæASSETSæ(in billions of dollars) 130 21%
2ETURNæONæASSETS 2.61%
Revenues by region
North America $ 2,442 (2)%
EMEA 3,486 4
Latin America 1,705 12
Asia 2,936 8
Total revenues $10,569 5%
Income from continuing operations by region
North America $ 447 (16)%
EMEA 1,142 (7)
Latin America 645 (3)
Asia 1,173 (7)
Total income from continuing operations $ 3,407 (7)%
Key indicators (in billions of dollars)
!VERAGEæDEPOSITSæANDæOTHERæCUSTOMERæLIABILITYæBALANCES $ 363 9%
%/0æASSETSæUNDERæCUSTODYæ (In trillions of dollars) 12.5 (1)
æ )NCLUDESæASSETSæUNDERæCUSTODYæASSETSæUNDERæTRUSTæANDæASSETSæUNDERæADMINISTRATION
.-æ .OTæMEANINGFUL
2011 vs. 2010
Net income decreased 7%, as higher expenses, driven by investment
spending, outpaced revenue growth. Year-over-year, the U.S. dollar
generally depreciated versus local currencies. As a result, the impact of FX
translation accounted for an approximately 1% growth in revenues and
expenses, respectively.
Revenues grew 5%, driven primarily by international growth, as
improvement in fees and increased deposit balances more than offset the
continued spread compression, which will likely continue to be a challenge
in 2012. Treasury and Trade Solutions revenues increased 5%, driven
primarily by growth in the trade and commercial cards businesses and
increased deposits, partially offset by the impact of the continued low rate
environment. Overall, Securities and Fund Services revenues increased
4% year-over-year, primarily due to growth in transaction and settlement
volumes, driven in part by the increase in activity resulting from market
volatility, and new client mandates. During the fourth quarter of 2011,
however, Securities and Fund Services experienced a 10% decline in revenues
as compared to the prior year period, driven by a significant decrease in
settlement volumes reflecting the overall decline in capital markets activity
during the latter part of 2011, spread compression and the impact of
FX translation.