Citibank 2011 Annual Report Download - page 193
Download and view the complete annual report
Please find page 193 of the 2011 Citibank annual report below. You can navigate through the pages in the report by either clicking on the pages listed below, or by using the keyword search tool below to find specific information within the annual report.-
 1
1 -
2
-
3
-
4
-
5
-
6
-
7
-
8
-
9
-
10
-
11
-
12
-
13
-
14
-
15
-
16
-
17
-
18
-
19
-
20
-
21
-
22
-
23
-
24
-
25
-
26
-
27
-
28
-
29
-
30
-
31
-
32
-
33
-
34
-
35
-
36
-
37
-
38
-
39
-
40
-
41
-
42
-
43
-
44
-
45
-
46
-
47
-
48
-
49
-
50
-
51
-
52
-
53
-
54
-
55
-
56
-
57
-
58
-
59
-
60
-
61
-
62
-
63
-
64
-
65
-
66
-
67
-
68
-
69
-
70
-
71
-
72
-
73
-
74
-
75
-
76
-
77
-
78
-
79
-
80
-
81
-
82
-
83
-
84
-
85
-
86
-
87
-
88
-
89
-
90
-
91
-
92
-
93
-
94
-
95
-
96
-
97
-
98
-
99
-
100
-
101
-
102
-
103
-
104
-
105
-
106
-
107
-
108
-
109
-
110
-
111
-
112
-
113
-
114
-
115
-
116
-
117
-
118
-
119
-
120
-
121
-
122
-
123
-
124
-
125
-
126
-
127
-
128
-
129
-
130
-
131
-
132
-
133
-
134
-
135
-
136
-
137
-
138
-
139
-
140
-
141
-
142
-
143
-
144
-
145
-
146
-
147
-
148
-
149
-
150
-
151
-
152
-
153
-
154
-
155
-
156
-
157
-
158
-
159
-
160
-
161
-
162
-
163
-
164
-
165
-
166
-
167
-
168
-
169
-
170
-
171
-
172
-
173
-
174
-
175
-
176
-
177
-
178
-
179
-
180
-
181
-
182
-
 183
183 -
 184
184 -
 185
185 -
 186
186 -
 187
187 -
 188
188 -
 189
189 -
 190
190 -
 191
191 -
 192
192 -
 193
193 -
 194
194 -
 195
195 -
 196
196 -
 197
197 -
 198
198 -
 199
199 -
 200
200 -
 201
201 -
 202
202 -
 203
203 -
204
-
205
-
206
-
207
-
208
-
209
-
210
-
211
-
212
-
213
-
214
-
215
-
216
-
217
-
218
-
219
-
220
-
221
-
222
-
223
-
224
-
225
-
226
-
227
-
228
-
229
-
230
-
231
-
232
-
233
-
234
-
235
-
236
-
237
-
238
-
239
-
240
-
241
-
242
-
243
-
244
-
245
-
246
-
247
-
248
-
249
-
250
-
251
-
252
-
253
-
254
-
255
-
256
-
257
-
258
-
259
-
260
-
261
-
262
-
263
-
264
-
265
-
266
-
267
-
268
-
269
-
270
-
271
-
272
-
273
-
274
-
275
-
276
-
277
-
278
-
279
-
280
-
281
-
282
-
283
-
284
-
285
-
286
-
287
-
288
-
289
-
290
-
291
-
292
-
293
-
294
-
295
-
296
-
297
-
298
-
299
-
300
-
301
-
302
-
303
-
304
-
305
-
306
-
307
-
308
-
309
-
310
-
311
-
312
-
313
-
314
-
315
-
316
-
317
-
318
-
319
-
320
 |
 |

171
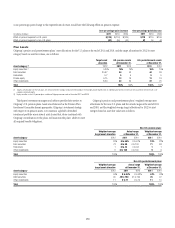
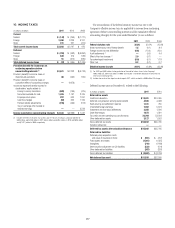
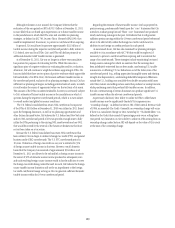
Fair Value Disclosure
For information on fair value measurements, including descriptions of Level 1, 2 and 3 of the fair value hierarchy and the valuation methodology utilized by
the Company, see “Significant Accounting Policies and Significant Estimates” and Note 25 to the Consolidated Financial Statements.
Certain investments may transfer between the fair value hierarchy classifications during the year due to changes in valuation methodology and pricing
sources. There were no significant transfers of investments between level 1 and level 2 during the years ended December 31, 2011 and 2010.
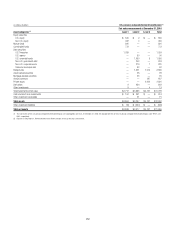
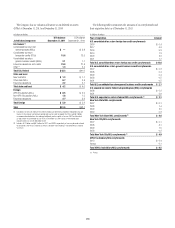
Plan assets by detailed asset categories and the fair value hierarchy are as follows:
In millions of dollars U.S. pension and postretirement benefit plans (1)
Fair value measurement at December 31, 2011
Asset categories Level 1 Level 2 Level 3 Total
%QUITYæSECURITIES æ
53æEQUITY $ 572 $ 5 $ 51 $ 628
.ON53æEQUITY 229 — 19 248
-UTUALæFUNDS 137 — — 137
#OMMINGLEDæFUNDS 440 594 — 1,034
$EBTæSECURITIES
53æ4REASURIES 1,760 — — 1,760
53æAGENCY — 120 — 120
53æCORPORATEæBONDSæ 2 1,073 5 1,080
.ON53æGOVERNMENTæDEBT — 352 — 352
.ON53æCORPORATEæBONDSæ 4 271 — 275
3TATEæANDæMUNICIPALæDEBT — 122 — 122
(EDGEæFUNDS — 1,087 870 1,957
!SSETBACKEDæSECURITIES —19— 19
-ORTGAGEBACKEDæSECURITIES —32— 32
!NNUITYæCONTRACTS — — 155 155
0RIVATEæEQUITY — — 2,474 2,474
$ERIVATIVES 691 36 — 727
/THERæINVESTMENTSæ 92 20 121 233
4OTALæINVESTMENTSæATæFAIRæVALUE $ 3,927 $ 3,731 $ 3,695 $ 11,353
#ASHæANDæSHORTTERMæINVESTMENTS $ 412 $ 402 $ — $ 814
/THERæINVESTMENTæRECEIVABLES — 393 221 614
Total assets $ 4,339 $ 4,526 $3,916 $ 12,781
/THERæINVESTMENTæLIABILITIES $ (683) $ (33) $ — $ (716)
Total net assets $ 3,656 $ 4,493 $3,916 $ 12,065
æ 4HEæINVESTMENTSæOFæTHEæ53æPENSIONæANDæPOSTRETIREMENTæBENEFITæPLANSæAREæCOMMINGLEDæINæONEæTRUSTæ!Tæ$ECEMBERæææTHEæALLOCABLEæINTERESTSæOFæTHEæ53æPENSIONæANDæPOSTRETIREMENTæBENEFITæPLANSæWEREææANDæ
æRESPECTIVELY