Citibank 2011 Annual Report Download - page 238
Download and view the complete annual report
Please find page 238 of the 2011 Citibank annual report below. You can navigate through the pages in the report by either clicking on the pages listed below, or by using the keyword search tool below to find specific information within the annual report.-
 1
1 -
2
-
3
-
4
-
5
-
6
-
7
-
8
-
9
-
10
-
11
-
12
-
13
-
14
-
15
-
16
-
17
-
18
-
19
-
20
-
21
-
22
-
23
-
24
-
25
-
26
-
27
-
28
-
29
-
30
-
31
-
32
-
33
-
34
-
35
-
36
-
37
-
38
-
39
-
40
-
41
-
42
-
43
-
44
-
45
-
46
-
47
-
48
-
49
-
50
-
51
-
52
-
53
-
54
-
55
-
56
-
57
-
58
-
59
-
60
-
61
-
62
-
63
-
64
-
65
-
66
-
67
-
68
-
69
-
70
-
71
-
72
-
73
-
74
-
75
-
76
-
77
-
78
-
79
-
80
-
81
-
82
-
83
-
84
-
85
-
86
-
87
-
88
-
89
-
90
-
91
-
92
-
93
-
94
-
95
-
96
-
97
-
98
-
99
-
100
-
101
-
102
-
103
-
104
-
105
-
106
-
107
-
108
-
109
-
110
-
111
-
112
-
113
-
114
-
115
-
116
-
117
-
118
-
119
-
120
-
121
-
122
-
123
-
124
-
125
-
126
-
127
-
128
-
129
-
130
-
131
-
132
-
133
-
134
-
135
-
136
-
137
-
138
-
139
-
140
-
141
-
142
-
143
-
144
-
145
-
146
-
147
-
148
-
149
-
150
-
151
-
152
-
153
-
154
-
155
-
156
-
157
-
158
-
159
-
160
-
161
-
162
-
163
-
164
-
165
-
166
-
167
-
168
-
169
-
170
-
171
-
172
-
173
-
174
-
175
-
176
-
177
-
178
-
179
-
180
-
181
-
182
-
183
-
184
-
185
-
186
-
187
-
188
-
189
-
190
-
191
-
192
-
193
-
194
-
195
-
196
-
197
-
198
-
199
-
200
-
201
-
202
-
203
-
204
-
205
-
206
-
207
-
208
-
209
-
210
-
211
-
212
-
213
-
214
-
215
-
216
-
217
-
218
-
219
-
220
-
221
-
222
-
223
-
224
-
225
-
226
-
227
-
 228
228 -
 229
229 -
 230
230 -
 231
231 -
 232
232 -
 233
233 -
 234
234 -
 235
235 -
 236
236 -
 237
237 -
 238
238 -
 239
239 -
 240
240 -
 241
241 -
 242
242 -
 243
243 -
 244
244 -
 245
245 -
 246
246 -
 247
247 -
 248
248 -
249
-
250
-
251
-
252
-
253
-
254
-
255
-
256
-
257
-
258
-
259
-
260
-
261
-
262
-
263
-
264
-
265
-
266
-
267
-
268
-
269
-
270
-
271
-
272
-
273
-
274
-
275
-
276
-
277
-
278
-
279
-
280
-
281
-
282
-
283
-
284
-
285
-
286
-
287
-
288
-
289
-
290
-
291
-
292
-
293
-
294
-
295
-
296
-
297
-
298
-
299
-
300
-
301
-
302
-
303
-
304
-
305
-
306
-
307
-
308
-
309
-
310
-
311
-
312
-
313
-
314
-
315
-
316
-
317
-
318
-
319
-
320
 |
 |

216
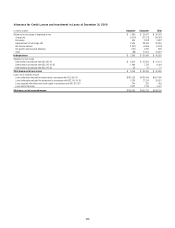
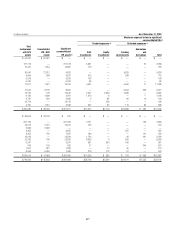
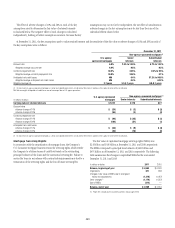
Citigroup’s involvement with consolidated and unconsolidated VIEs with which the Company holds significant variable interests or has continuing
involvement through servicing a majority of the assets in a VIE as of December 31, 2011 and December 31, 2010 is presented below:
In millions of dollars As of December 31, 2011
æ
Maximum exposure to loss in significant
unconsolidated VIEs
(1)
æFunded exposures (2) Unfunded exposures (3)
Citicorp
Total
involvement
with SPE
assets
Consolidated
VIE / SPE assets
Significant
unconsolidated
VIE assets (4)
Debt
investments
Equity
investments
Funding
commitments
Guarantees
and
derivatives Total
#REDITæCARDæSECURITIZATIONS $ 56,177 $ 56,177 $ — $ — $ — $ — $ — $ —
-ORTGAGEæSECURITIZATIONSæ
ææ53æAGENCYSPONSORED 232,179 — 232,179 3,769 — — 26 3,795
ææ.ONAGENCYSPONSORED 11,167 1,705 9,462 372 — — — 372
#ITIADMINISTEREDæASSETBACKEDæ
COMMERCIALæPAPERæCONDUITSæ!"#0 34,987 21,971 13,016 — — 13,016 — 13,016
4HIRDPARTYæCOMMERCIALæPAPERæCONDUITS 7,955 — 7,955 448 — 298 — 746
#OLLATERALIZEDæDEBTæOBLIGATIONSæ#$/S 3,334 — 3,334 20 — — — 20
#OLLATERALIZEDæLOANæOBLIGATIONSæ#,/S 8,127 — 8,127 64 — — — 64
!SSETBASEDæFINANCING 18,586 1,303 17,283 7,444 2 2,891 121 10,458
-UNICIPALæSECURITIESæTENDERææ
OPTIONæBONDæTRUSTSæ4/"S 16,849 8,224 8,625 708 — 5,413 — 6,121
-UNICIPALæINVESTMENTS 19,931 299 19,632 2,220 3,397 1,439 — 7,056
#LIENTæINTERMEDIATION 2,110 24 2,086 468 — — — 468
)NVESTMENTæFUNDS 3,415 30 3,385 — 171 63 — 234
4RUSTæPREFERREDæSECURITIES 17,882 — 17,882 — 128 — — 128
/THER 6,210 97 6,113 354 172 279 79 884
Total $438,909 $ 89,830 $ 349,079 $ 15,867 $ 3,870 $ 23,399 $ 226 $ 43,362
Citi Holdings
#REDITæCARDæSECURITIZATIONS $ 31,686 $ 31,487 $ 199 $ — $ — $ — $ — $ —
-ORTGAGEæSECURITIZATIONS
ææ53æAGENCYSPONSORED 152,265 — 152,265 1,159 — — 120 1,279
ææ.ONAGENCYSPONSORED 17,396 1,681 15,715 56 — — 2 58
3TUDENTæLOANæSECURITIZATIONS 1,822 1,822 — — — — — —
4HIRDPARTYæCOMMERCIALæPAPERæCONDUITS —— ——————
#OLLATERALIZEDæDEBTæOBLIGATIONSæ#$/S 6,581 — 6,581 117 — — 120 237
#OLLATERALIZEDæLOANæOBLIGATIONSæ#,/S 7,479 — 7,479 1,125 — 6 90 1,221
!SSETBASEDæFINANCING 11,927 73 11,854 5,008 3 250 — 5,261
-UNICIPALæINVESTMENTS 5,637 — 5,637 206 265 71 — 542
#LIENTæINTERMEDIATION 111 111 — — — — — —
)NVESTMENTæFUNDS 1,114 14 1,100 — 43 — — 43
/THER 6,762 6,581 181 3 36 15 — 54
Total $242,780 $ 41,769 $ 201,011 $ 7,674 $ 347 $ 342 $ 332 $ 8,695
Total Citigroup $681,689 $131,599 $ 550,090 $ 23,541 $4,217 $ 23,741 $558 $ 52,057
æ 4HEæDEFINITIONæOFæMAXIMUMæEXPOSUREæTOæLOSSæISæINCLUDEDæINæTHEæTEXTæTHATæFOLLOWS
æ )NCLUDEDæINæ#ITIGROUPSæ$ECEMBERæææ#ONSOLIDATEDæ"ALANCEæ3HEET
æ .OTæINCLUDEDæINæ#ITIGROUPSæ$ECEMBERæææ#ONSOLIDATEDæ"ALANCEæ3HEET
æ !æSIGNIFICANTæUNCONSOLIDATEDæ6)%æISæANæENTITYæWHEREæTHEæ#OMPANYæHASæANYæVARIABLEæINTERESTæCONSIDEREDæTOæBEæSIGNIFICANTæREGARDLESSæOFæTHEæLIKELIHOODæOFæLOSSæORæTHEæNOTIONALæAMOUNTæOFæEXPOSURE
æ #ITICORPæMORTGAGEæSECURITIZATIONSæALSOæINCLUDEæAGENCYæANDæNONAGENCYæPRIVATEæLABELæRESECURITIZATIONæACTIVITIESæ4HESEæ30%SæAREæNOTæCONSOLIDATEDæ3EEæh2E3ECURITIZATIONSvæBELOWæFORæFURTHERæDISCUSSION
2ECLASSIFIEDæTOæCONFORMæTOæTHEæCURRENTæYEARSæPRESENTATION