Citibank 2011 Annual Report Download - page 268
Download and view the complete annual report
Please find page 268 of the 2011 Citibank annual report below. You can navigate through the pages in the report by either clicking on the pages listed below, or by using the keyword search tool below to find specific information within the annual report.-
 1
1 -
2
-
3
-
4
-
5
-
6
-
7
-
8
-
9
-
10
-
11
-
12
-
13
-
14
-
15
-
16
-
17
-
18
-
19
-
20
-
21
-
22
-
23
-
24
-
25
-
26
-
27
-
28
-
29
-
30
-
31
-
32
-
33
-
34
-
35
-
36
-
37
-
38
-
39
-
40
-
41
-
42
-
43
-
44
-
45
-
46
-
47
-
48
-
49
-
50
-
51
-
52
-
53
-
54
-
55
-
56
-
57
-
58
-
59
-
60
-
61
-
62
-
63
-
64
-
65
-
66
-
67
-
68
-
69
-
70
-
71
-
72
-
73
-
74
-
75
-
76
-
77
-
78
-
79
-
80
-
81
-
82
-
83
-
84
-
85
-
86
-
87
-
88
-
89
-
90
-
91
-
92
-
93
-
94
-
95
-
96
-
97
-
98
-
99
-
100
-
101
-
102
-
103
-
104
-
105
-
106
-
107
-
108
-
109
-
110
-
111
-
112
-
113
-
114
-
115
-
116
-
117
-
118
-
119
-
120
-
121
-
122
-
123
-
124
-
125
-
126
-
127
-
128
-
129
-
130
-
131
-
132
-
133
-
134
-
135
-
136
-
137
-
138
-
139
-
140
-
141
-
142
-
143
-
144
-
145
-
146
-
147
-
148
-
149
-
150
-
151
-
152
-
153
-
154
-
155
-
156
-
157
-
158
-
159
-
160
-
161
-
162
-
163
-
164
-
165
-
166
-
167
-
168
-
169
-
170
-
171
-
172
-
173
-
174
-
175
-
176
-
177
-
178
-
179
-
180
-
181
-
182
-
183
-
184
-
185
-
186
-
187
-
188
-
189
-
190
-
191
-
192
-
193
-
194
-
195
-
196
-
197
-
198
-
199
-
200
-
201
-
202
-
203
-
204
-
205
-
206
-
207
-
208
-
209
-
210
-
211
-
212
-
213
-
214
-
215
-
216
-
217
-
218
-
219
-
220
-
221
-
222
-
223
-
224
-
225
-
226
-
227
-
228
-
229
-
230
-
231
-
232
-
233
-
234
-
235
-
236
-
237
-
238
-
239
-
240
-
241
-
242
-
243
-
244
-
245
-
246
-
247
-
248
-
249
-
250
-
251
-
252
-
253
-
254
-
255
-
256
-
257
-
 258
258 -
 259
259 -
 260
260 -
 261
261 -
 262
262 -
 263
263 -
 264
264 -
 265
265 -
 266
266 -
 267
267 -
 268
268 -
 269
269 -
 270
270 -
 271
271 -
 272
272 -
 273
273 -
 274
274 -
 275
275 -
 276
276 -
 277
277 -
 278
278 -
279
-
280
-
281
-
282
-
283
-
284
-
285
-
286
-
287
-
288
-
289
-
290
-
291
-
292
-
293
-
294
-
295
-
296
-
297
-
298
-
299
-
300
-
301
-
302
-
303
-
304
-
305
-
306
-
307
-
308
-
309
-
310
-
311
-
312
-
313
-
314
-
315
-
316
-
317
-
318
-
319
-
320
 |
 |

246
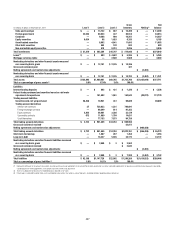
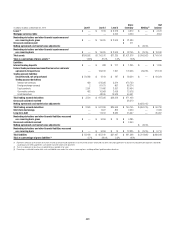
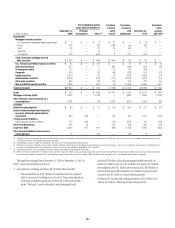
Items Measured at Fair Value on a Recurring Basis
The following tables present for each of the fair value hierarchy levels
the Company’s assets and liabilities that are measured at fair value on
a recurring basis at December 31, 2011 and December 31, 2010. The
Company’s hedging of positions that have been classified in the Level 3
category is not limited to other financial instruments that have been
classified as Level 3, but also instruments classified as Level 1 or Level 2 of
the fair value hierarchy. The effects of these hedges are presented gross in the
following table.
In millions of dollars at December 31, 2011 Level 1 Level 2 Level 3
Gross
inventory Netting (1)
Net
balance
Assets
Federal funds sold and securities borrowed or purchased under
agreements to resell $ — $ 188,034 $ 4,701 $ 192,735 $ (49,873) $142,862
Trading securities
Trading mortgage-backed securities
53æGOVERNMENTSPONSOREDæAGENCYæGUARANTEED $ — $ 26,674 $ 861 $ 27,535 $ — $ 27,535
0RIME — 118 759 877 — 877
!LT! — 444 165 609 — 609
3UBPRIME — 524 465 989 — 989
.ON53æRESIDENTIAL — 276 120 396 — 396
#OMMERCIAL — 1,715 618 2,333 — 2,333
Total trading mortgage-backed securities $ — $ 29,751 $ 2,988 $ 32,739 $ — $ 32,739
U.S. Treasury and federal agency securities
53æ4REASURY $ 15,612 $ 2,615 $ — $ 18,227 $ — $ 18,227
!GENCYæOBLIGATIONS — 1,169 3 1,172 — 1,172
Total U.S. Treasury and federal agency securities $ 15,612 $ 3,784$3$19,399 $ — $ 19,399
State and municipal $ — $ 5,112 $ 252 $ 5,364 $ — $ 5,364
Foreign government 52,429 26,601 521 79,551 — 79,551
Corporate — 33,786 3,240 37,026 — 37,026
Equity securities 29,707 3,279 244 33,230 — 33,230
Asset-backed securities — 1,270 5,801 7,071 — 7,071
Other debt securities — 12,818 2,209 15,027 — 15,027
Total trading securities $ 97,748 $ 116,401 $15,258 $ 229,407 $ — $229,407
Trading account derivatives
)NTERESTæRATEæCONTRACTS $ 67 $ 755,473 $ 1,947 $ 757,487
&OREIGNæEXCHANGEæCONTRACTS — 93,536 781 94,317
%QUITYæCONTRACTS 2,240 16,376 1,619 20,235
#OMMODITYæCONTRACTS 958 11,940 865 13,763
#REDITæDERIVATIVES — 81,123 9,301 90,424
Total trading account derivatives $ 3,265 $ 958,448 $14,513 $ 976,226
Gross cash collateral paid 57,815
Netting agreements and market value adjustments $ (971,714)
Total trading account derivatives $ 3,265 $ 958,448 $14,513 $1,034,041 $ (971,714) $ 62,327
Investments
Mortgage-backed securities
53æGOVERNMENTSPONSOREDæAGENCYæGUARANTEED $ 59 $ 45,043 $ 679 $ 45,781 $ — $ 45,781
0RIME — 105 8 113 — 113
!LT! —1—1—1
3UBPRIME ———— ——
.ON53æRESIDENTIAL — 4,658 — 4,658 — 4,658
#OMMERCIAL — 472 — 472 — 472
Total investment mortgage-backed securities $ 59 $ 50,279 $ 687 $ 51,025 $ — $ 51,025
U.S. Treasury and federal agency securities
53æ4REASURY $ 11,642 $ 38,587 $ — $ 50,229 $ — $ 50,229
!GENCYæOBLIGATIONS — 34,834 75 34,909 — 34,909
Total U.S. Treasury and federal agency securities $ 11,642 $ 73,421 $ 75 $ 85,138 $ — $ 85,138