Citibank 2011 Annual Report Download - page 230
Download and view the complete annual report
Please find page 230 of the 2011 Citibank annual report below. You can navigate through the pages in the report by either clicking on the pages listed below, or by using the keyword search tool below to find specific information within the annual report.-
 1
1 -
 2
2 -
 3
3 -
 4
4 -
 5
5 -
 6
6 -
 7
7 -
 8
8 -
 9
9 -
 10
10 -
 11
11 -
 12
12 -
 13
13 -
 14
14 -
 15
15 -
 16
16 -
 17
17 -
 18
18 -
 19
19 -
 20
20 -
 21
21 -
 22
22 -
 23
23 -
 24
24 -
 25
25 -
 26
26 -
 27
27 -
 28
28 -
 29
29 -
 30
30 -
 31
31 -
 32
32 -
 33
33 -
 34
34 -
 35
35 -
 36
36 -
 37
37 -
 38
38 -
 39
39 -
 40
40 -
 41
41 -
 42
42 -
 43
43 -
 44
44 -
 45
45 -
 46
46 -
 47
47 -
 48
48 -
 49
49 -
 50
50 -
 51
51 -
 52
52 -
 53
53 -
 54
54 -
 55
55 -
 56
56 -
 57
57 -
 58
58 -
 59
59 -
 60
60 -
 61
61 -
 62
62 -
 63
63 -
 64
64 -
 65
65 -
 66
66 -
 67
67 -
 68
68 -
 69
69 -
 70
70 -
 71
71 -
 72
72 -
 73
73 -
 74
74 -
 75
75 -
 76
76 -
 77
77 -
 78
78 -
 79
79 -
 80
80 -
 81
81 -
 82
82 -
 83
83 -
 84
84 -
 85
85 -
 86
86 -
 87
87 -
 88
88 -
 89
89 -
 90
90 -
 91
91 -
 92
92 -
 93
93 -
 94
94 -
 95
95 -
 96
96 -
 97
97 -
 98
98 -
 99
99 -
 100
100 -
 101
101 -
 102
102 -
 103
103 -
 104
104 -
 105
105 -
 106
106 -
 107
107 -
 108
108 -
 109
109 -
 110
110 -
 111
111 -
 112
112 -
 113
113 -
 114
114 -
 115
115 -
 116
116 -
 117
117 -
 118
118 -
 119
119 -
 120
120 -
 121
121 -
 122
122 -
 123
123 -
 124
124 -
 125
125 -
 126
126 -
 127
127 -
 128
128 -
 129
129 -
 130
130 -
 131
131 -
 132
132 -
 133
133 -
 134
134 -
 135
135 -
 136
136 -
 137
137 -
 138
138 -
 139
139 -
 140
140 -
 141
141 -
 142
142 -
 143
143 -
 144
144 -
 145
145 -
 146
146 -
 147
147 -
 148
148 -
 149
149 -
 150
150 -
 151
151 -
 152
152 -
 153
153 -
 154
154 -
 155
155 -
 156
156 -
 157
157 -
 158
158 -
 159
159 -
 160
160 -
 161
161 -
 162
162 -
 163
163 -
 164
164 -
 165
165 -
 166
166 -
 167
167 -
 168
168 -
 169
169 -
 170
170 -
 171
171 -
 172
172 -
 173
173 -
 174
174 -
 175
175 -
 176
176 -
 177
177 -
 178
178 -
 179
179 -
 180
180 -
 181
181 -
 182
182 -
 183
183 -
 184
184 -
 185
185 -
 186
186 -
 187
187 -
 188
188 -
 189
189 -
 190
190 -
 191
191 -
 192
192 -
 193
193 -
 194
194 -
 195
195 -
 196
196 -
 197
197 -
 198
198 -
 199
199 -
 200
200 -
 201
201 -
 202
202 -
 203
203 -
 204
204 -
 205
205 -
 206
206 -
 207
207 -
 208
208 -
 209
209 -
 210
210 -
 211
211 -
 212
212 -
 213
213 -
 214
214 -
 215
215 -
 216
216 -
 217
217 -
 218
218 -
 219
219 -
 220
220 -
 221
221 -
 222
222 -
 223
223 -
 224
224 -
 225
225 -
 226
226 -
 227
227 -
 228
228 -
 229
229 -
 230
230 -
 231
231 -
 232
232 -
 233
233 -
 234
234 -
 235
235 -
 236
236 -
 237
237 -
 238
238 -
 239
239 -
 240
240 -
 241
241 -
 242
242 -
 243
243 -
 244
244 -
 245
245 -
 246
246 -
 247
247 -
 248
248 -
 249
249 -
 250
250 -
 251
251 -
 252
252 -
 253
253 -
 254
254 -
 255
255 -
 256
256 -
 257
257 -
 258
258 -
 259
259 -
 260
260 -
 261
261 -
 262
262 -
 263
263 -
 264
264 -
 265
265 -
 266
266 -
 267
267 -
 268
268 -
 269
269 -
 270
270 -
 271
271 -
 272
272 -
 273
273 -
 274
274 -
 275
275 -
 276
276 -
 277
277 -
 278
278 -
 279
279 -
 280
280 -
 281
281 -
 282
282 -
 283
283 -
 284
284 -
 285
285 -
 286
286 -
 287
287 -
 288
288 -
 289
289 -
 290
290 -
 291
291 -
 292
292 -
 293
293 -
 294
294 -
 295
295 -
 296
296 -
 297
297 -
 298
298 -
 299
299 -
 300
300 -
 301
301 -
 302
302 -
 303
303 -
 304
304 -
 305
305 -
 306
306 -
 307
307 -
 308
308 -
 309
309 -
 310
310 -
 311
311 -
 312
312 -
 313
313 -
 314
314 -
 315
315 -
 316
316 -
 317
317 -
 318
318 -
 319
319 -
 320
320
 |
 |

208
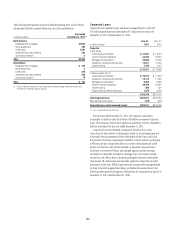
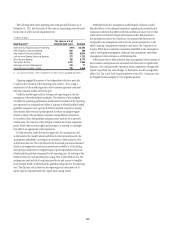
The following table shows reporting units with goodwill balances as of
December 31, 2011 and the excess of fair value as a percentage over allocated
book value as of the annual impairment test.
In millions of dollars
Reporting unit (1)
Fair value as a % of
allocated book value Goodwill
North America Regional Consumer Banking 279% $ 2,542
EMEA Regional Consumer Banking 205 349
Asia Regional Consumer Banking 285 5,623
Latin America Regional Consumer Banking 277 1,722
Securities and Banking 136 9,173
Transaction Services 1,761 1,564
Brokerage and Asset Management 162 71
Local Consumer Lending—Cards 175 4,369
æ Local Consumer Lending—OtheræISæEXCLUDEDæFROMæTHEæTABLEæASæTHEREæISæNOæGOODWILLæALLOCATEDæTOæIT
Citigroup engaged the services of an independent valuation specialist
to assist in the valuation of the reporting units at July 1, 2011, using a
combination of the market approach and/or income approach consistent
with the valuation model used in the past.
Under the market approach for valuing each reporting unit, the key
assumption is the selected price multiples. The selection of the multiples
considers the operating performance and financial condition of the reporting
unit operations as compared with those of a group of selected publicly traded
guideline companies and a group of selected acquired companies. Among
other factors, the level and expected growth in return on tangible equity
relative to those of the guideline companies and guideline transactions
is considered. Since the guideline company prices used are on a minority
interest basis, the selection of the multiple considers the recent acquisition
prices, which reflect control rights and privileges, in arriving at a multiple
that reflects an appropriate control premium.
For the valuation under the income approach, the assumptions used
as the basis for the model include cash flows for the forecasted period, the
assumptions embedded in arriving at an estimation of the terminal value
and the discount rate. The cash flows for the forecasted period are estimated
based on management’s most recent projections available as of the testing
date, giving consideration to targeted equity capital requirements based on
selected public guideline companies for the reporting unit. In arriving at the
terminal value for each reporting unit, using 2014 as the terminal year, the
assumptions used include a long-term growth rate and a price-to-tangible
book multiple based on selected public guideline companies for the reporting
unit. The discount rate is based on the reporting unit’s estimated cost of
equity capital computed under the capital asset pricing model.
Embedded in the key assumptions underlying the valuation model,
described above, is the inherent uncertainty regarding the possibility that
economic conditions that affect credit risk and behavior may vary or other
events will occur that will impact the business model. Deterioration in
the assumptions used in the valuations, in particular the discount-rate
and growth-rate assumptions used in the net income projections, could
affect Citigroup’s impairment evaluation and, hence, the Company’s net
income. While there is inherent uncertainty embedded in the assumptions
used in developing management’s forecasts, the assumptions used reflect
management’s best estimates as of the testing date.
If the future were to differ adversely from management’s best estimate of
key economic assumptions and associated cash flows were to significantly
decrease, Citi could potentially experience future impairment charges with
respect to goodwill. Any such charges, by themselves, would not negatively
affect Citi’s Tier 1 and Total Capital regulatory ratios, Tier 1 Common ratio,
its Tangible Common Equity or Citi’s liquidity position.
