Citibank 2011 Annual Report Download - page 299
Download and view the complete annual report
Please find page 299 of the 2011 Citibank annual report below. You can navigate through the pages in the report by either clicking on the pages listed below, or by using the keyword search tool below to find specific information within the annual report.-
 1
1 -
2
-
3
-
4
-
5
-
6
-
7
-
8
-
9
-
10
-
11
-
12
-
13
-
14
-
15
-
16
-
17
-
18
-
19
-
20
-
21
-
22
-
23
-
24
-
25
-
26
-
27
-
28
-
29
-
30
-
31
-
32
-
33
-
34
-
35
-
36
-
37
-
38
-
39
-
40
-
41
-
42
-
43
-
44
-
45
-
46
-
47
-
48
-
49
-
50
-
51
-
52
-
53
-
54
-
55
-
56
-
57
-
58
-
59
-
60
-
61
-
62
-
63
-
64
-
65
-
66
-
67
-
68
-
69
-
70
-
71
-
72
-
73
-
74
-
75
-
76
-
77
-
78
-
79
-
80
-
81
-
82
-
83
-
84
-
85
-
86
-
87
-
88
-
89
-
90
-
91
-
92
-
93
-
94
-
95
-
96
-
97
-
98
-
99
-
100
-
101
-
102
-
103
-
104
-
105
-
106
-
107
-
108
-
109
-
110
-
111
-
112
-
113
-
114
-
115
-
116
-
117
-
118
-
119
-
120
-
121
-
122
-
123
-
124
-
125
-
126
-
127
-
128
-
129
-
130
-
131
-
132
-
133
-
134
-
135
-
136
-
137
-
138
-
139
-
140
-
141
-
142
-
143
-
144
-
145
-
146
-
147
-
148
-
149
-
150
-
151
-
152
-
153
-
154
-
155
-
156
-
157
-
158
-
159
-
160
-
161
-
162
-
163
-
164
-
165
-
166
-
167
-
168
-
169
-
170
-
171
-
172
-
173
-
174
-
175
-
176
-
177
-
178
-
179
-
180
-
181
-
182
-
183
-
184
-
185
-
186
-
187
-
188
-
189
-
190
-
191
-
192
-
193
-
194
-
195
-
196
-
197
-
198
-
199
-
200
-
201
-
202
-
203
-
204
-
205
-
206
-
207
-
208
-
209
-
210
-
211
-
212
-
213
-
214
-
215
-
216
-
217
-
218
-
219
-
220
-
221
-
222
-
223
-
224
-
225
-
226
-
227
-
228
-
229
-
230
-
231
-
232
-
233
-
234
-
235
-
236
-
237
-
238
-
239
-
240
-
241
-
242
-
243
-
244
-
245
-
246
-
247
-
248
-
249
-
250
-
251
-
252
-
253
-
254
-
255
-
256
-
257
-
258
-
259
-
260
-
261
-
262
-
263
-
264
-
265
-
266
-
267
-
268
-
269
-
270
-
271
-
272
-
273
-
274
-
275
-
276
-
277
-
278
-
279
-
280
-
281
-
282
-
283
-
284
-
285
-
286
-
287
-
288
-
 289
289 -
 290
290 -
 291
291 -
 292
292 -
 293
293 -
 294
294 -
 295
295 -
 296
296 -
 297
297 -
 298
298 -
 299
299 -
 300
300 -
 301
301 -
 302
302 -
 303
303 -
 304
304 -
 305
305 -
 306
306 -
 307
307 -
 308
308 -
 309
309 -
310
-
311
-
312
-
313
-
314
-
315
-
316
-
317
-
318
-
319
-
320
 |
 |

277
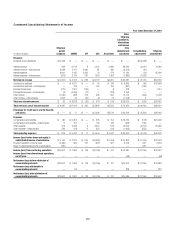
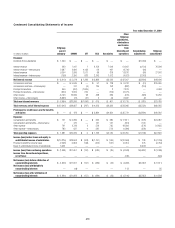
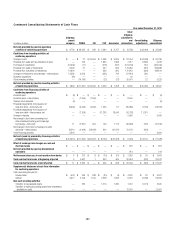
Condensed Consolidating Statements of Income
Year ended December 31, 2011
In millions of dollars
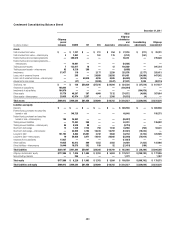
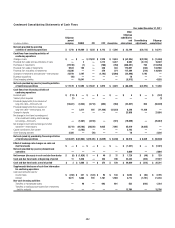
Citigroup
parent
company CGMHI CFI CCC Associates
Other
Citigroup
subsidiaries,
eliminations
and income
from
discontinued
operations
Consolidating
adjustments
Citigroup
consolidated
Revenues
$IVIDENDSæFROMæSUBSIDIARIES $13,046 $ — $ — $ — $ — $ — $(13,046) $ —
)NTERESTæREVENUE 220 5,852 — 4,036 4,666 61,943 (4,036) 72,681
)NTERESTæREVENUEINTERCOMPANY 3,464 2,143 2,496 101 370 (8,473) (101) —
)NTERESTæEXPENSE 8,138 2,387 2,057 97 281 11,371 (97) 24,234
)NTERESTæEXPENSEINTERCOMPANY (520) 3,357 432 1,438 1,261 (4,530) (1,438) —
Net interest revenue $ (3,934) $ 2,251 $ 7 $ 2,602 $ 3,494 $ 46,629 $ (2,602) $48,447
#OMMISSIONSæANDæFEES $ — $ 4,209 $ — $ 6 $ 85 $ 8,556 $ (6) $12,850
#OMMISSIONSæANDæFEESINTERCOMPANY — 24 — 84 98 (122) (84) —
0RINCIPALæTRANSACTIONS (166) 1,540 2,253 — (22) 3,629 — 7,234
0RINCIPALæTRANSACTIONSINTERCOMPANY (4) (793) (1,208) — — 2,005 — —
/THERæINCOME (3,891) 719 27 562 603 12,364 (562) 9,822
/THERæINCOMEINTERCOMPANY 5,000 377 75 (115) 6 (5,458) 115 —
Total non-interest revenues $ 939 $ 6,076 $ 1,147 $ 537 $ 770 $ 20,974 $ (537) $29,906
Total revenues, net of interest expense $10,051 $ 8,327 $ 1,154 $ 3,139 $ 4,264 $ 67,603 $(16,185) $78,353
Provisions for credit losses and for benefits
and claims $ — $ 7 $ — $ 1,518 $ 1,707 $ 11,082 $ (1,518) $12,796
Expenses
#OMPENSATIONæANDæBENEFITS $ 133 $ 5,540 $ — $ 449 $ 632 $ 19,383 $ (449) $25,688
#OMPENSATIONæANDæBENEFITSINTERCOMPANY 7 237 — 117 117 (361) (117) —
/THERæEXPENSE 948 2,734 2 572 712 20,849 (572) 25,245
/THERæEXPENSEINTERCOMPANY 415 718 (34) 332 386 (1,485) (332) —
Total operating expenses $ 1,503 $ 9,229 $ (32) $ 1,470 $ 1,847 $ 38,386 $ (1,470) $50,933
Income (loss) before taxes and equity in
undistributed income of subsidiaries $ 8,548 $ (909) $ 1,186 $ 151 $ 710 $ 18,135 $(13,197) $14,624
0ROVISIONæBENEFITæFORæINCOMEæTAXES (1,821) (238) 422 44 295 4,863 (44) 3,521
%QUITYæINæUNDISTRIBUTEDæINCOMEæOFæSUBSIDIARIES 698 — — — — — (698) —
Income (loss) from continuing operations $11,067 $ (671) $ 764 $ 107 $ 415 $ 13,272 $(13,851) $11,103
Income (loss) from discontinued operations,
net of taxes — — — — — 112 — 112
Net income (loss) before attribution of
noncontrolling interests $11,067 $ (671) $ 764 $ 107 $ 415 $ 13,384 $(13,851) $11,215
Net income (loss) attributable to
noncontrolling interests — 25 — — — 123 — 148
Net income (loss) after attribution of
noncontrolling interests $11,067 $ (696) $ 764 $ 107 $ 415 $ 13,261 $(13,851) $11,067