Citibank 2011 Annual Report Download - page 259
Download and view the complete annual report
Please find page 259 of the 2011 Citibank annual report below. You can navigate through the pages in the report by either clicking on the pages listed below, or by using the keyword search tool below to find specific information within the annual report.-
 1
1 -
2
-
3
-
4
-
5
-
6
-
7
-
8
-
9
-
10
-
11
-
12
-
13
-
14
-
15
-
16
-
17
-
18
-
19
-
20
-
21
-
22
-
23
-
24
-
25
-
26
-
27
-
28
-
29
-
30
-
31
-
32
-
33
-
34
-
35
-
36
-
37
-
38
-
39
-
40
-
41
-
42
-
43
-
44
-
45
-
46
-
47
-
48
-
49
-
50
-
51
-
52
-
53
-
54
-
55
-
56
-
57
-
58
-
59
-
60
-
61
-
62
-
63
-
64
-
65
-
66
-
67
-
68
-
69
-
70
-
71
-
72
-
73
-
74
-
75
-
76
-
77
-
78
-
79
-
80
-
81
-
82
-
83
-
84
-
85
-
86
-
87
-
88
-
89
-
90
-
91
-
92
-
93
-
94
-
95
-
96
-
97
-
98
-
99
-
100
-
101
-
102
-
103
-
104
-
105
-
106
-
107
-
108
-
109
-
110
-
111
-
112
-
113
-
114
-
115
-
116
-
117
-
118
-
119
-
120
-
121
-
122
-
123
-
124
-
125
-
126
-
127
-
128
-
129
-
130
-
131
-
132
-
133
-
134
-
135
-
136
-
137
-
138
-
139
-
140
-
141
-
142
-
143
-
144
-
145
-
146
-
147
-
148
-
149
-
150
-
151
-
152
-
153
-
154
-
155
-
156
-
157
-
158
-
159
-
160
-
161
-
162
-
163
-
164
-
165
-
166
-
167
-
168
-
169
-
170
-
171
-
172
-
173
-
174
-
175
-
176
-
177
-
178
-
179
-
180
-
181
-
182
-
183
-
184
-
185
-
186
-
187
-
188
-
189
-
190
-
191
-
192
-
193
-
194
-
195
-
196
-
197
-
198
-
199
-
200
-
201
-
202
-
203
-
204
-
205
-
206
-
207
-
208
-
209
-
210
-
211
-
212
-
213
-
214
-
215
-
216
-
217
-
218
-
219
-
220
-
221
-
222
-
223
-
224
-
225
-
226
-
227
-
228
-
229
-
230
-
231
-
232
-
233
-
234
-
235
-
236
-
237
-
238
-
239
-
240
-
241
-
242
-
243
-
244
-
245
-
246
-
247
-
248
-
 249
249 -
 250
250 -
 251
251 -
 252
252 -
 253
253 -
 254
254 -
 255
255 -
 256
256 -
 257
257 -
 258
258 -
 259
259 -
 260
260 -
 261
261 -
 262
262 -
 263
263 -
 264
264 -
 265
265 -
 266
266 -
 267
267 -
 268
268 -
 269
269 -
270
-
271
-
272
-
273
-
274
-
275
-
276
-
277
-
278
-
279
-
280
-
281
-
282
-
283
-
284
-
285
-
286
-
287
-
288
-
289
-
290
-
291
-
292
-
293
-
294
-
295
-
296
-
297
-
298
-
299
-
300
-
301
-
302
-
303
-
304
-
305
-
306
-
307
-
308
-
309
-
310
-
311
-
312
-
313
-
314
-
315
-
316
-
317
-
318
-
319
-
320
 |
 |

237
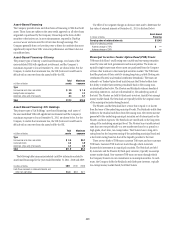
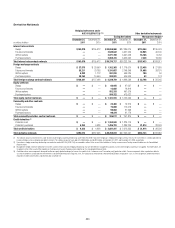
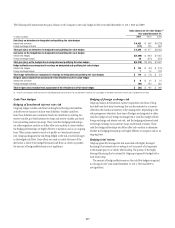
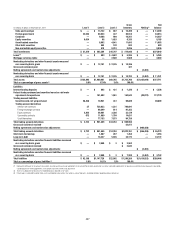
The following table summarizes the gains (losses) on the Company’s fair value hedges for the years ended December 31, 2011, 2010 and 2009:
Gains (losses) on fair value hedges
Year ended December 31,
(1)
In millions of dollars 2011
Gain (loss) on derivatives in designated and qualifying fair value hedges
)NTERESTæRATEæCONTRACTS $ 4,423
&OREIGNæEXCHANGEæCONTRACTS (117)
Total gain (loss) on derivatives in designated and qualifying fair value hedges $ 4,306
Gain (loss) on the hedged item in designated and qualifying fair value hedges
)NTERESTæRATEæHEDGES $(4,296)
&OREIGNæEXCHANGEæHEDGES 26
Total gain (loss) on the hedged item in designated and qualifying fair value hedges $(4,270)
Hedge ineffectiveness recognized in earnings on designated and qualifying fair value hedges
)NTERESTæRATEæHEDGES $ 118
&OREIGNæEXCHANGEæHEDGES 1
Total hedge ineffectiveness recognized in earnings on designated and qualifying fair value hedges $ 119
Net gain (loss) excluded from assessment of the effectiveness of fair value hedges
)NTERESTæRATEæCONTRACTS $9
&OREIGNæEXCHANGEæCONTRACTS (92)
Total net gain (loss) excluded from assessment of the effectiveness of fair value hedges $ (83)
æ !MOUNTSæAREæINCLUDEDæINæOther revenueæONæTHEæ#ONSOLIDATEDæ3TATEMENTæOFæ)NCOMEæ4HEæACCRUEDæINTERESTæINCOMEæONæFAIRæVALUEæHEDGESæISæRECORDEDæINæNet interest revenueæANDæISæEXCLUDEDæFROMæTHISæTABLE
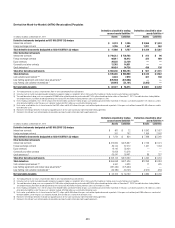
Cash Flow Hedges
Hedging of benchmark interest rate risk
Citigroup hedges variable cash flows resulting from floating-rate liabilities
and rollover (re-issuance) of short-term liabilities. Variable cash flows
from those liabilities are converted to fixed-rate cash flows by entering into
receive-variable, pay-fixed interest rate swaps and receive-variable, pay-fixed
forward-starting interest rate swaps. These cash-flow hedging relationships
use either regression analysis or dollar-offset ratio analysis to assess whether
the hedging relationships are highly effective at inception and on an ongoing
basis. When certain interest rates do not qualify as a benchmark interest
rate, Citigroup designates the risk being hedged as the risk of overall changes
in the hedged cash flows. Since efforts are made to match the terms of the
derivatives to those of the hedged forecasted cash flows as closely as possible,
the amount of hedge ineffectiveness is not significant.
Hedging of foreign exchange risk
Citigroup locks in the functional currency equivalent cash flows of long-
term debt and short-term borrowings that are denominated in a currency
other than the functional currency of the issuing entity. Depending on the
risk management objectives, these types of hedges are designated as either
cash flow hedges of only foreign exchange risk or cash flow hedges of both
foreign exchange and interest rate risk, and the hedging instruments used
are foreign exchange cross-currency swaps and forward contracts. These
cash flow hedge relationships use dollar-offset ratio analysis to determine
whether the hedging relationships are highly effective at inception and on an
ongoing basis.
Hedging total return
Citigroup generally manages the risk associated with highly leveraged
financing it has entered into by seeking to sell a majority of its exposures
to the market prior to or shortly after funding. The portion of the highly
leveraged financing that is retained by Citigroup is generally hedged with a
total return swap.
The amount of hedge ineffectiveness on the cash flow hedges recognized
in earnings for the years ended December 31, 2011, 2010 and 2009 is
not significant.