Citibank 2011 Annual Report Download - page 100
Download and view the complete annual report
Please find page 100 of the 2011 Citibank annual report below. You can navigate through the pages in the report by either clicking on the pages listed below, or by using the keyword search tool below to find specific information within the annual report.-
 1
1 -
2
-
3
-
4
-
5
-
6
-
7
-
8
-
9
-
10
-
11
-
12
-
13
-
14
-
15
-
16
-
17
-
18
-
19
-
20
-
21
-
22
-
23
-
24
-
25
-
26
-
27
-
28
-
29
-
30
-
31
-
32
-
33
-
34
-
35
-
36
-
37
-
38
-
39
-
40
-
41
-
42
-
43
-
44
-
45
-
46
-
47
-
48
-
49
-
50
-
51
-
52
-
53
-
54
-
55
-
56
-
57
-
58
-
59
-
60
-
61
-
62
-
63
-
64
-
65
-
66
-
67
-
68
-
69
-
70
-
71
-
72
-
73
-
74
-
75
-
76
-
77
-
78
-
79
-
80
-
81
-
82
-
83
-
84
-
85
-
86
-
87
-
88
-
89
-
 90
90 -
 91
91 -
 92
92 -
 93
93 -
 94
94 -
 95
95 -
 96
96 -
 97
97 -
 98
98 -
 99
99 -
 100
100 -
 101
101 -
 102
102 -
 103
103 -
 104
104 -
 105
105 -
 106
106 -
 107
107 -
 108
108 -
 109
109 -
 110
110 -
111
-
112
-
113
-
114
-
115
-
116
-
117
-
118
-
119
-
120
-
121
-
122
-
123
-
124
-
125
-
126
-
127
-
128
-
129
-
130
-
131
-
132
-
133
-
134
-
135
-
136
-
137
-
138
-
139
-
140
-
141
-
142
-
143
-
144
-
145
-
146
-
147
-
148
-
149
-
150
-
151
-
152
-
153
-
154
-
155
-
156
-
157
-
158
-
159
-
160
-
161
-
162
-
163
-
164
-
165
-
166
-
167
-
168
-
169
-
170
-
171
-
172
-
173
-
174
-
175
-
176
-
177
-
178
-
179
-
180
-
181
-
182
-
183
-
184
-
185
-
186
-
187
-
188
-
189
-
190
-
191
-
192
-
193
-
194
-
195
-
196
-
197
-
198
-
199
-
200
-
201
-
202
-
203
-
204
-
205
-
206
-
207
-
208
-
209
-
210
-
211
-
212
-
213
-
214
-
215
-
216
-
217
-
218
-
219
-
220
-
221
-
222
-
223
-
224
-
225
-
226
-
227
-
228
-
229
-
230
-
231
-
232
-
233
-
234
-
235
-
236
-
237
-
238
-
239
-
240
-
241
-
242
-
243
-
244
-
245
-
246
-
247
-
248
-
249
-
250
-
251
-
252
-
253
-
254
-
255
-
256
-
257
-
258
-
259
-
260
-
261
-
262
-
263
-
264
-
265
-
266
-
267
-
268
-
269
-
270
-
271
-
272
-
273
-
274
-
275
-
276
-
277
-
278
-
279
-
280
-
281
-
282
-
283
-
284
-
285
-
286
-
287
-
288
-
289
-
290
-
291
-
292
-
293
-
294
-
295
-
296
-
297
-
298
-
299
-
300
-
301
-
302
-
303
-
304
-
305
-
306
-
307
-
308
-
309
-
310
-
311
-
312
-
313
-
314
-
315
-
316
-
317
-
318
-
319
-
320
 |
 |
78
the foreclosure process when loans are 90+ days past due, not all such loans
become part of Citi’s foreclosure inventory as Citi may not refer such loans
to foreclosure as it continues to work with the borrower pursuant to its loss
mitigation programs, or for other reasons. This also decreased the number of
residential first mortgages moving into Citi’s foreclosure inventory.
Second, while loans exited foreclosure inventory during 2011, this
was not necessarily due to completion of foreclosure and sale. Loans may
exit foreclosure inventory if Citi renews efforts to work with the borrower
pursuant to its loss mitigation programs, if the borrower enters bankruptcy
proceedings, if Citi decides not to pursue the foreclosure, or for other reasons.
In each of the circumstances described in the discussion above, however, the
loans continue to age through Citi’s delinquency buckets and remain part of
its non-accrual assets.
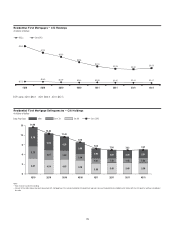
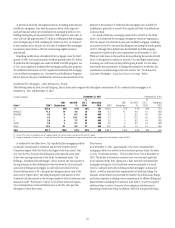
In addition to the decline in the actual number of completed foreclosures,
the overall foreclosure process has lengthened. This is particularly
pronounced in judicial states (i.e., those states that require foreclosures to
be processed via court approval)—including New York, New Jersey, Florida
and Illinois—but has also occurred in non-judicial states where Citi has a
higher concentration of residential first mortgages (see “Residential First
Mortgages—State Delinquency Trends” above). The lengthening of the
foreclosure process is due to numerous factors, including without limitation
the increased state requirements referenced above, Citi’s continued work
with borrowers through its various modification programs and the overall
depressed state of home sales in certain of Citi’s high concentration markets.
As one example of the lengthening of the foreclosure process, Citi’s aged
foreclosure inventory (active foreclosures in process for two years or more),
as a proportion of Citi’s total foreclosure inventory, more than doubled year
over year. While the proportion of aged foreclosure inventory continued to
represent a small portion of the total (approximately 10%, as of December 31,
2011), Citi believes this trend reflects the increased time involved in the
foreclosure process, and believes this trend could continue due, in part, to the
issues discussed above.
When combined with the continued pressure on home prices,
particularly in certain regions where Citi has a higher concentration of
residential first mortgages, this lengthening of the foreclosure process also
subjects Citi to increased “severity” risk, or the magnitude of the loss on
the amount ultimately realized for the property subject to foreclosure, as
well as increased ongoing costs related to the foreclosure process, such as
property maintenance.
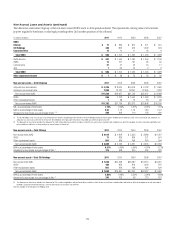
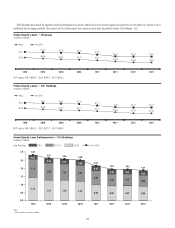
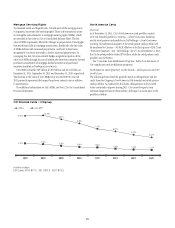
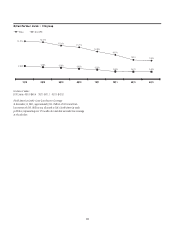
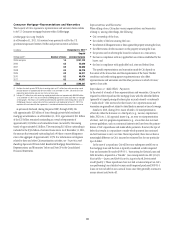
North America Consumer Mortgage Quarterly Credit Trends—
Delinquencies and Net Credit Losses—Home Equity Loans
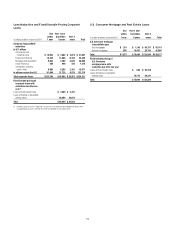
Citi’s home equity loan portfolio consists of both fixed rate home equity loans
and loans extended under home equity lines of credit. Fixed rate home equity
loans are fully amortizing. Home equity lines of credit allow for amounts
to be drawn for a period of time and then, at the end of the draw period,
the then-outstanding amount is converted to an amortizing loan. After
conversion, the loan typically has a 20-year amortization repayment period.
Historically, Citi’s home equity lines of credit typically had a 10-year draw
period. Beginning in June 2010, Citi’s new originations of home equity lines
of credit typically have a five-year draw period as Citi changed these terms
to mitigate risk due to the economic environment and declining home
prices. As of December 31, 2011, Citi’s home equity loan portfolio included
approximately $25 billion of home equity lines of credit that are still within
their revolving period and have not commenced amortization (the interest-
only payment feature during the revolving period is standard for this product
across the industry). The vast majority of Citi’s home equity loans extended
under lines of credit as of December 31, 2011 will contractually begin to
amortize after 2014.
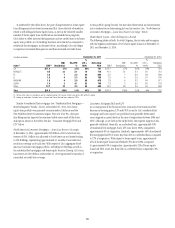
As of December 31, 2011, the percentage of U.S. home equity loans in
a junior lien position where Citi also owned or serviced the first lien was
approximately 31%. However, for all home equity loans (regardless of
whether Citi owns or services the first lien), Citi manages its home equity
loan account strategy through obtaining and reviewing refreshed credit
bureau scores (which reflect the borrower’s performance on all of its debts,
including a first lien, if any), refreshed LTV ratios and other borrower credit-
related information. Historically, the default and delinquency statistics for
junior liens where Citi also owns or services the first lien have been better
than for those where Citi does not own or service the first lien, which Citi
believes is generally attributable to origination channels and better credit
characteristics of the portfolio, including FICO and LTV, for those junior liens
where Citi also owns or services the first lien.