Citibank 2011 Annual Report Download - page 305
Download and view the complete annual report
Please find page 305 of the 2011 Citibank annual report below. You can navigate through the pages in the report by either clicking on the pages listed below, or by using the keyword search tool below to find specific information within the annual report.-
 1
1 -
2
-
3
-
4
-
5
-
6
-
7
-
8
-
9
-
10
-
11
-
12
-
13
-
14
-
15
-
16
-
17
-
18
-
19
-
20
-
21
-
22
-
23
-
24
-
25
-
26
-
27
-
28
-
29
-
30
-
31
-
32
-
33
-
34
-
35
-
36
-
37
-
38
-
39
-
40
-
41
-
42
-
43
-
44
-
45
-
46
-
47
-
48
-
49
-
50
-
51
-
52
-
53
-
54
-
55
-
56
-
57
-
58
-
59
-
60
-
61
-
62
-
63
-
64
-
65
-
66
-
67
-
68
-
69
-
70
-
71
-
72
-
73
-
74
-
75
-
76
-
77
-
78
-
79
-
80
-
81
-
82
-
83
-
84
-
85
-
86
-
87
-
88
-
89
-
90
-
91
-
92
-
93
-
94
-
95
-
96
-
97
-
98
-
99
-
100
-
101
-
102
-
103
-
104
-
105
-
106
-
107
-
108
-
109
-
110
-
111
-
112
-
113
-
114
-
115
-
116
-
117
-
118
-
119
-
120
-
121
-
122
-
123
-
124
-
125
-
126
-
127
-
128
-
129
-
130
-
131
-
132
-
133
-
134
-
135
-
136
-
137
-
138
-
139
-
140
-
141
-
142
-
143
-
144
-
145
-
146
-
147
-
148
-
149
-
150
-
151
-
152
-
153
-
154
-
155
-
156
-
157
-
158
-
159
-
160
-
161
-
162
-
163
-
164
-
165
-
166
-
167
-
168
-
169
-
170
-
171
-
172
-
173
-
174
-
175
-
176
-
177
-
178
-
179
-
180
-
181
-
182
-
183
-
184
-
185
-
186
-
187
-
188
-
189
-
190
-
191
-
192
-
193
-
194
-
195
-
196
-
197
-
198
-
199
-
200
-
201
-
202
-
203
-
204
-
205
-
206
-
207
-
208
-
209
-
210
-
211
-
212
-
213
-
214
-
215
-
216
-
217
-
218
-
219
-
220
-
221
-
222
-
223
-
224
-
225
-
226
-
227
-
228
-
229
-
230
-
231
-
232
-
233
-
234
-
235
-
236
-
237
-
238
-
239
-
240
-
241
-
242
-
243
-
244
-
245
-
246
-
247
-
248
-
249
-
250
-
251
-
252
-
253
-
254
-
255
-
256
-
257
-
258
-
259
-
260
-
261
-
262
-
263
-
264
-
265
-
266
-
267
-
268
-
269
-
270
-
271
-
272
-
273
-
274
-
275
-
276
-
277
-
278
-
279
-
280
-
281
-
282
-
283
-
284
-
285
-
286
-
287
-
288
-
289
-
290
-
291
-
292
-
293
-
294
-
 295
295 -
 296
296 -
 297
297 -
 298
298 -
 299
299 -
 300
300 -
 301
301 -
 302
302 -
 303
303 -
 304
304 -
 305
305 -
 306
306 -
 307
307 -
 308
308 -
 309
309 -
 310
310 -
 311
311 -
 312
312 -
 313
313 -
 314
314 -
 315
315 -
316
-
317
-
318
-
319
-
320
 |
 |

283
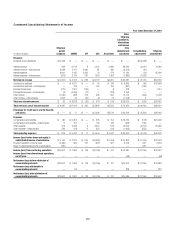
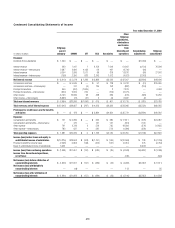
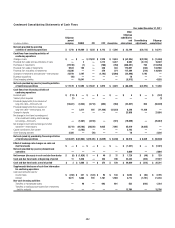
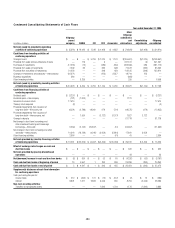
Condensed Consolidating Statements of Cash Flows
Year ended December 31, 2010
In millions of dollars
Citigroup
parent
company CGMHI CFI CCC Associates
Other
Citigroup
subsidiaries
and
eliminations
Consolidating
adjustments
Citigroup
consolidated
Net cash provided by (used in) operating
activities of continuing operations
Cash flows from investing activities of
continuing operations
#HANGEæINæLOANS
0ROCEEDSæFROMæSALESæANDæSECURITIZATIONSæOFæLOANS
0URCHASESæOFæINVESTMENTS
0ROCEEDSæFROMæSALESæOFæINVESTMENTS
0ROCEEDSæFROMæMATURITIESæOFæINVESTMENTS
#HANGESæINæINVESTMENTSæANDæADVANCESINTERCOMPANY
"USINESSæACQUISITIONS
/THERæINVESTINGæACTIVITIESæ
Net cash provided by (used in) investing activities
of continuing operations
Cash flows from financing activities of
continuing operations
$IVIDENDSæPAID
$IVIDENDSæPAIDINTERCOMPANY
4REASURYæSTOCKæACQUIRED
0ROCEEDSREPAYMENTSæFROMæISSUANCEæOFææ
LONGTERMæDEBTTHIRDPARTYæNET
0ROCEEDSREPAYMENTSæFROMæISSUANCEæOFææ
LONGTERMæDEBTINTERCOMPANYæNET
#HANGEæINæDEPOSITS
.ETæCHANGEæINæSHORTTERMæBORROWINGSæANDææ
OTHERæINVESTMENTæBANKINGæANDæBROKERAGEææ
BORROWINGSTHIRDPARTY
.ETæCHANGEæINæSHORTTERMæBORROWINGSæANDæOTHERææ
ADVANCESINTERCOMPANY
/THERæFINANCINGæACTIVITIESæ
Net cash (used in) provided by financing activities
of continuing operations
Effect of exchange rate changes on cash and
due from banks
Net cash provided by (used in) discontinued
operations
Net increase (decrease) in cash and due from banks
Cash and due from banks at beginning of period
Cash and due from banks at end of period
Supplemental disclosure of cash flow information
for continuing operations
#ASHæPAIDæDURINGæTHEæYEARæFOR
)NCOMEæTAXES
)NTEREST
Non-cash investing activities
4RANSFERSæTOæREPOSSESSEDæASSETS
4RANSFERSæTOæTRADINGæACCOUNTINGæASSETSæFROMæINVESTMENTSæ
AVAILABLEFORSALE