Citibank 2011 Annual Report Download - page 241
Download and view the complete annual report
Please find page 241 of the 2011 Citibank annual report below. You can navigate through the pages in the report by either clicking on the pages listed below, or by using the keyword search tool below to find specific information within the annual report.-
 1
1 -
 2
2 -
 3
3 -
 4
4 -
 5
5 -
 6
6 -
 7
7 -
 8
8 -
 9
9 -
 10
10 -
 11
11 -
 12
12 -
 13
13 -
 14
14 -
 15
15 -
 16
16 -
 17
17 -
 18
18 -
 19
19 -
 20
20 -
 21
21 -
 22
22 -
 23
23 -
 24
24 -
 25
25 -
 26
26 -
 27
27 -
 28
28 -
 29
29 -
 30
30 -
 31
31 -
 32
32 -
 33
33 -
 34
34 -
 35
35 -
 36
36 -
 37
37 -
 38
38 -
 39
39 -
 40
40 -
 41
41 -
 42
42 -
 43
43 -
 44
44 -
 45
45 -
 46
46 -
 47
47 -
 48
48 -
 49
49 -
 50
50 -
 51
51 -
 52
52 -
 53
53 -
 54
54 -
 55
55 -
 56
56 -
 57
57 -
 58
58 -
 59
59 -
 60
60 -
 61
61 -
 62
62 -
 63
63 -
 64
64 -
 65
65 -
 66
66 -
 67
67 -
 68
68 -
 69
69 -
 70
70 -
 71
71 -
 72
72 -
 73
73 -
 74
74 -
 75
75 -
 76
76 -
 77
77 -
 78
78 -
 79
79 -
 80
80 -
 81
81 -
 82
82 -
 83
83 -
 84
84 -
 85
85 -
 86
86 -
 87
87 -
 88
88 -
 89
89 -
 90
90 -
 91
91 -
 92
92 -
 93
93 -
 94
94 -
 95
95 -
 96
96 -
 97
97 -
 98
98 -
 99
99 -
 100
100 -
 101
101 -
 102
102 -
 103
103 -
 104
104 -
 105
105 -
 106
106 -
 107
107 -
 108
108 -
 109
109 -
 110
110 -
 111
111 -
 112
112 -
 113
113 -
 114
114 -
 115
115 -
 116
116 -
 117
117 -
 118
118 -
 119
119 -
 120
120 -
 121
121 -
 122
122 -
 123
123 -
 124
124 -
 125
125 -
 126
126 -
 127
127 -
 128
128 -
 129
129 -
 130
130 -
 131
131 -
 132
132 -
 133
133 -
 134
134 -
 135
135 -
 136
136 -
 137
137 -
 138
138 -
 139
139 -
 140
140 -
 141
141 -
 142
142 -
 143
143 -
 144
144 -
 145
145 -
 146
146 -
 147
147 -
 148
148 -
 149
149 -
 150
150 -
 151
151 -
 152
152 -
 153
153 -
 154
154 -
 155
155 -
 156
156 -
 157
157 -
 158
158 -
 159
159 -
 160
160 -
 161
161 -
 162
162 -
 163
163 -
 164
164 -
 165
165 -
 166
166 -
 167
167 -
 168
168 -
 169
169 -
 170
170 -
 171
171 -
 172
172 -
 173
173 -
 174
174 -
 175
175 -
 176
176 -
 177
177 -
 178
178 -
 179
179 -
 180
180 -
 181
181 -
 182
182 -
 183
183 -
 184
184 -
 185
185 -
 186
186 -
 187
187 -
 188
188 -
 189
189 -
 190
190 -
 191
191 -
 192
192 -
 193
193 -
 194
194 -
 195
195 -
 196
196 -
 197
197 -
 198
198 -
 199
199 -
 200
200 -
 201
201 -
 202
202 -
 203
203 -
 204
204 -
 205
205 -
 206
206 -
 207
207 -
 208
208 -
 209
209 -
 210
210 -
 211
211 -
 212
212 -
 213
213 -
 214
214 -
 215
215 -
 216
216 -
 217
217 -
 218
218 -
 219
219 -
 220
220 -
 221
221 -
 222
222 -
 223
223 -
 224
224 -
 225
225 -
 226
226 -
 227
227 -
 228
228 -
 229
229 -
 230
230 -
 231
231 -
 232
232 -
 233
233 -
 234
234 -
 235
235 -
 236
236 -
 237
237 -
 238
238 -
 239
239 -
 240
240 -
 241
241 -
 242
242 -
 243
243 -
 244
244 -
 245
245 -
 246
246 -
 247
247 -
 248
248 -
 249
249 -
 250
250 -
 251
251 -
 252
252 -
 253
253 -
 254
254 -
 255
255 -
 256
256 -
 257
257 -
 258
258 -
 259
259 -
 260
260 -
 261
261 -
 262
262 -
 263
263 -
 264
264 -
 265
265 -
 266
266 -
 267
267 -
 268
268 -
 269
269 -
 270
270 -
 271
271 -
 272
272 -
 273
273 -
 274
274 -
 275
275 -
 276
276 -
 277
277 -
 278
278 -
 279
279 -
 280
280 -
 281
281 -
 282
282 -
 283
283 -
 284
284 -
 285
285 -
 286
286 -
 287
287 -
 288
288 -
 289
289 -
 290
290 -
 291
291 -
 292
292 -
 293
293 -
 294
294 -
 295
295 -
 296
296 -
 297
297 -
 298
298 -
 299
299 -
 300
300 -
 301
301 -
 302
302 -
 303
303 -
 304
304 -
 305
305 -
 306
306 -
 307
307 -
 308
308 -
 309
309 -
 310
310 -
 311
311 -
 312
312 -
 313
313 -
 314
314 -
 315
315 -
 316
316 -
 317
317 -
 318
318 -
 319
319 -
 320
320
 |
 |

219
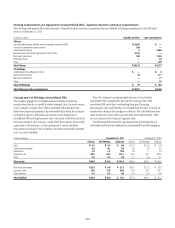
Funding Commitments for Significant Unconsolidated VIEs—Liquidity Facilities and Loan Commitments
The following table presents the notional amount of liquidity facilities and loan commitments that are classified as funding commitments in the VIE tables
above as of December 31, 2011:
In millions of dollars Liquidity facilities Loan commitments
Citicorp
#ITIADMINISTEREDæASSETBACKEDæCOMMERCIALæPAPERæCONDUITSæ!"#0 $13,016 $ —
4HIRDPARTYæCOMMERCIALæPAPERæCONDUITS 298 —
!SSETBASEDæFINANCING 5 2,886
-UNICIPALæSECURITIESæTENDERæOPTIONæBONDæTRUSTSæ4/"S 5,413 —
-UNICIPALæINVESTMENTS 390 1,049
)NVESTMENTæFUNDS —63
/THER — 279
Total Citicorp $19,122 $4,277
Citi Holdings
#OLLATERALIZEDæLOANæOBLIGATIONSæ#,/S $— $6
!SSETBASEDæFINANCING 79 171
-UNICIPALæINVESTMENTS —71
/THER —15
Total Citi Holdings $ 79 $ 263
Total Citigroup funding commitments $19,201 $4,540
Citicorp and Citi Holdings Consolidated VIEs
The Company engages in on-balance-sheet securitizations which are
securitizations that do not qualify for sales treatment; thus, the assets remain
on the Company’s balance sheet. The consolidated VIEs included in the
tables below represent hundreds of separate entities with which the Company
is involved. In general, the third-party investors in the obligations of
consolidated VIEs have legal recourse only to the assets of the VIEs and do not
have such recourse to the Company, except where the Company has provided
a guarantee to the investors or is the counterparty to certain derivative
transactions involving the VIE. In addition, the assets are generally restricted
only to pay such liabilities.
Thus, the Company’s maximum legal exposure to loss related to
consolidated VIEs is significantly less than the carrying value of the
consolidated VIE assets due to outstanding third-party financing.
Intercompany assets and liabilities are excluded from the table. All assets are
restricted from being sold or pledged as collateral. The cash flows from these
assets are the only source used to pay down the associated liabilities, which
are non-recourse to the Company’s general assets.
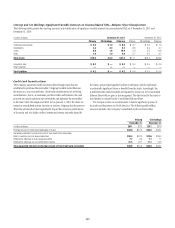
The following table presents the carrying amounts and classifications of
consolidated assets that are collateral for consolidated VIE and SPE obligations:
In billions of dollars December 31, 2011 $ECEMBERææ
Citicorp Citi Holdings Citigroup #ITICORP #ITIæ(OLDINGS #ITIGROUP
#ASH $ 0.2 $ 0.4 $ 0.6
4RADINGæACCOUNTæASSETS 0.4 0.1 0.5
)NVESTMENTS 7.9 2.7 10.6 ææ
4OTALæLOANSæNET 80.8 38.3 119.1
/THER 0.5 0.3 0.8
Total assets $89.8 $ 41.8 $ 131.6
3HORTTERMæBORROWINGS $22.5 $ 0.8 $ 23.3
,ONGTERMæDEBT 32.6 17.9 50.5
/THERæLIABILITIES 0.4 0.2 0.6
Total liabilities $55.5 $ 18.9 $ 74.4
