Citibank 2011 Annual Report Download - page 122
Download and view the complete annual report
Please find page 122 of the 2011 Citibank annual report below. You can navigate through the pages in the report by either clicking on the pages listed below, or by using the keyword search tool below to find specific information within the annual report.-
 1
1 -
2
-
3
-
4
-
5
-
6
-
7
-
8
-
9
-
10
-
11
-
12
-
13
-
14
-
15
-
16
-
17
-
18
-
19
-
20
-
21
-
22
-
23
-
24
-
25
-
26
-
27
-
28
-
29
-
30
-
31
-
32
-
33
-
34
-
35
-
36
-
37
-
38
-
39
-
40
-
41
-
42
-
43
-
44
-
45
-
46
-
47
-
48
-
49
-
50
-
51
-
52
-
53
-
54
-
55
-
56
-
57
-
58
-
59
-
60
-
61
-
62
-
63
-
64
-
65
-
66
-
67
-
68
-
69
-
70
-
71
-
72
-
73
-
74
-
75
-
76
-
77
-
78
-
79
-
80
-
81
-
82
-
83
-
84
-
85
-
86
-
87
-
88
-
89
-
90
-
91
-
92
-
93
-
94
-
95
-
96
-
97
-
98
-
99
-
100
-
101
-
102
-
103
-
104
-
105
-
106
-
107
-
108
-
109
-
110
-
111
-
 112
112 -
 113
113 -
 114
114 -
 115
115 -
 116
116 -
 117
117 -
 118
118 -
 119
119 -
 120
120 -
 121
121 -
 122
122 -
 123
123 -
 124
124 -
 125
125 -
 126
126 -
 127
127 -
 128
128 -
 129
129 -
 130
130 -
 131
131 -
 132
132 -
133
-
134
-
135
-
136
-
137
-
138
-
139
-
140
-
141
-
142
-
143
-
144
-
145
-
146
-
147
-
148
-
149
-
150
-
151
-
152
-
153
-
154
-
155
-
156
-
157
-
158
-
159
-
160
-
161
-
162
-
163
-
164
-
165
-
166
-
167
-
168
-
169
-
170
-
171
-
172
-
173
-
174
-
175
-
176
-
177
-
178
-
179
-
180
-
181
-
182
-
183
-
184
-
185
-
186
-
187
-
188
-
189
-
190
-
191
-
192
-
193
-
194
-
195
-
196
-
197
-
198
-
199
-
200
-
201
-
202
-
203
-
204
-
205
-
206
-
207
-
208
-
209
-
210
-
211
-
212
-
213
-
214
-
215
-
216
-
217
-
218
-
219
-
220
-
221
-
222
-
223
-
224
-
225
-
226
-
227
-
228
-
229
-
230
-
231
-
232
-
233
-
234
-
235
-
236
-
237
-
238
-
239
-
240
-
241
-
242
-
243
-
244
-
245
-
246
-
247
-
248
-
249
-
250
-
251
-
252
-
253
-
254
-
255
-
256
-
257
-
258
-
259
-
260
-
261
-
262
-
263
-
264
-
265
-
266
-
267
-
268
-
269
-
270
-
271
-
272
-
273
-
274
-
275
-
276
-
277
-
278
-
279
-
280
-
281
-
282
-
283
-
284
-
285
-
286
-
287
-
288
-
289
-
290
-
291
-
292
-
293
-
294
-
295
-
296
-
297
-
298
-
299
-
300
-
301
-
302
-
303
-
304
-
305
-
306
-
307
-
308
-
309
-
310
-
311
-
312
-
313
-
314
-
315
-
316
-
317
-
318
-
319
-
320
 |
 |
100
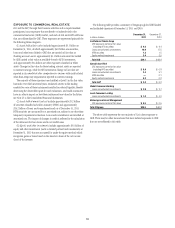
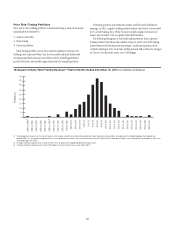
Average Rates
-
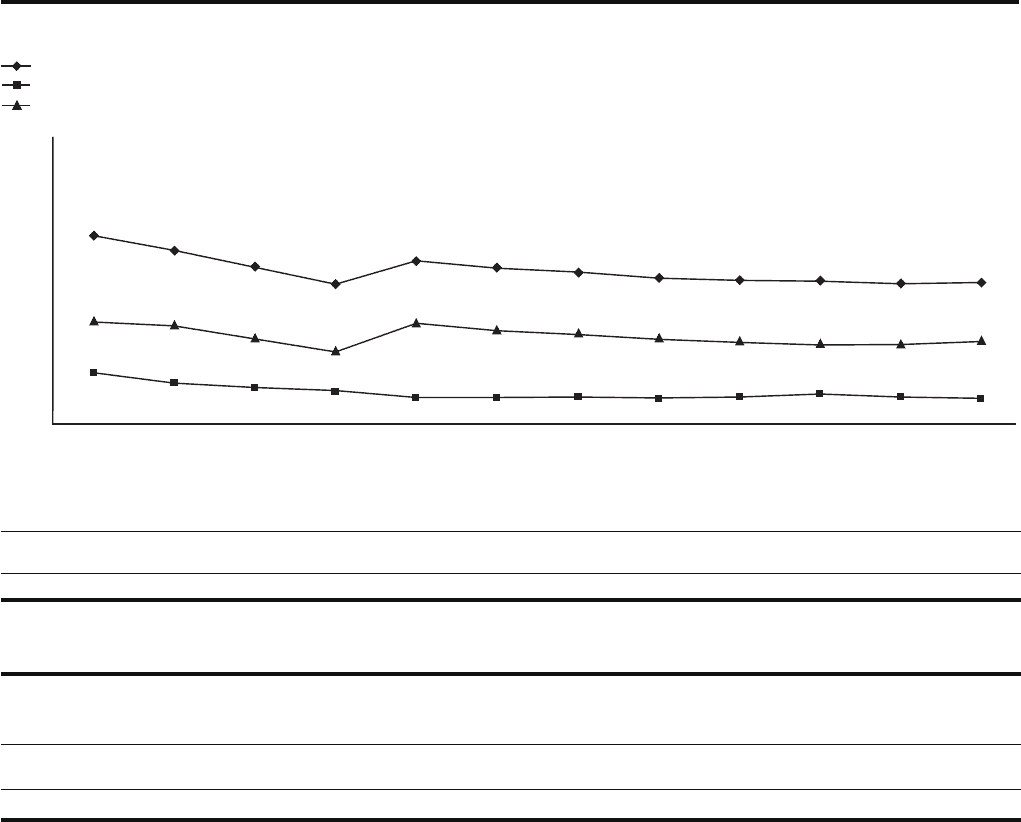
Interest Revenue, Interest Expense and Net Interest Margin
INTEREST REVENUE/EXPENSE AND YIELDS
Interest Expense-Average Rate
Interest Revenue-Average Rate
Net Interest Margin
1.00%
2.00%
3.00%
4.00%
5.00%
6.00%
7.00%
1Q09 2Q09 3Q09 4Q09 1Q10 2Q10 3Q10 4Q10 1Q11 2Q11 3Q11 4Q11
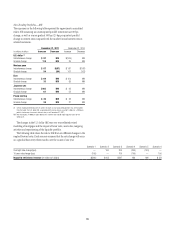
In millions of dollars 2011
Change
2011 vs. 2010
#HANGEæ
æVSæ
)NTERESTæREVENUE $ 73,201 (8)%
)NTERESTæEXPENSE 24,229 (3)
.ETæINTERESTæREVENUEæ $ 48,972 (10)%
)NTERESTæREVENUEAVERAGEæRATE 4.27% (28) bps æBPS
)NTERESTæEXPENSEAVERAGEæRATE 1.63 2 bps æBPS
.ETæINTERESTæMARGIN 2.86 (26) bps æBPS
Interest-rate benchmarks æ
&EDERALæ&UNDSæRATEENDæOFæPERIOD 0.00–0.25% n n —
&EDERALæ&UNDSæRATEAVERAGEæRATE 0.00–0.25 næ n —
4WOYEARæ53æ4REASURYæNOTEAVERAGEæRATE 0.45% (25) bps æBPS
YEARæ53æ4REASURYæNOTEAVERAGEæRATE 2.78 (43) bps æBPS
YEARæVSæTWOYEARæSPREADæ 233 bps æBPS æBPS
æ Net interest revenueæINCLUDESæTHEæTAXABLEæEQUIVALENTæADJUSTMENTSæBASEDæONæTHEæ53æFEDERALæSTATUTORYæTAXæRATEæOFææOFææMILLIONææMILLIONæANDææMILLIONæFORæææANDææRESPECTIVELY
æ %XCLUDESæEXPENSESæASSOCIATEDæWITHæCERTAINæHYBRIDæFINANCIALæINSTRUMENTSæ4HESEæOBLIGATIONSæAREæCLASSIFIEDæASæLong-term debtæANDæACCOUNTEDæFORæATæFAIRæVALUEæWITHæCHANGESæRECORDEDæINæPrincipal transactions
æ 4HEæINCREASEæINæTHEæNETæINTERESTæREVENUEæFROMæTHEæFOURTHæQUARTERæOFææTOæTHEæFIRSTæQUARTERæOFææWASæPRIMARILYæDRIVENæBYæTHEæADOPTIONæOFæ3&!3ææONæ*ANUARYæææ3EEæ.OTEææTOæTHEæ#ONSOLIDATEDæ&INANCIALæ
3TATEMENTSæFORæFURTHERæINFORMATION
As described under “Market Risk” above, a significant portion of Citi’s
business activities are based upon gathering deposits and borrowing money
and then lending or investing those funds, or participating in market-
making activities in tradable securities. Citi’s net interest margin (NIM) is
calculated by dividing gross interest revenue less gross interest expense by
average interest earning assets.
During 2011, Citi’s NIM declined as compared to the prior year, decreasing
by approximately 26 basis points, primarily driven by the continued run-off
and sales of higher-yielding assets in Citi Holdings and lower investment
yields driven by the continued low interest rate environment, partially offset
by the growth of lower-yielding loans in Citicorp and lower borrowing costs
(e.g., substituting maturing long-term debt with deposits as a funding
source). Absent any significant changes or events (e.g., a significant portfolio
sale in Citi Holdings), Citi expects NIM will likely continue to reflect the
pressure of a low interest rate environment, but should generally stabilize
around end-of-year-2011 levels.