Citibank 2011 Annual Report Download - page 133
Download and view the complete annual report
Please find page 133 of the 2011 Citibank annual report below. You can navigate through the pages in the report by either clicking on the pages listed below, or by using the keyword search tool below to find specific information within the annual report.-
 1
1 -
2
-
3
-
4
-
5
-
6
-
7
-
8
-
9
-
10
-
11
-
12
-
13
-
14
-
15
-
16
-
17
-
18
-
19
-
20
-
21
-
22
-
23
-
24
-
25
-
26
-
27
-
28
-
29
-
30
-
31
-
32
-
33
-
34
-
35
-
36
-
37
-
38
-
39
-
40
-
41
-
42
-
43
-
44
-
45
-
46
-
47
-
48
-
49
-
50
-
51
-
52
-
53
-
54
-
55
-
56
-
57
-
58
-
59
-
60
-
61
-
62
-
63
-
64
-
65
-
66
-
67
-
68
-
69
-
70
-
71
-
72
-
73
-
74
-
75
-
76
-
77
-
78
-
79
-
80
-
81
-
82
-
83
-
84
-
85
-
86
-
87
-
88
-
89
-
90
-
91
-
92
-
93
-
94
-
95
-
96
-
97
-
98
-
99
-
100
-
101
-
102
-
103
-
104
-
105
-
106
-
107
-
108
-
109
-
110
-
111
-
112
-
113
-
114
-
115
-
116
-
117
-
118
-
119
-
120
-
121
-
122
-
 123
123 -
 124
124 -
 125
125 -
 126
126 -
 127
127 -
 128
128 -
 129
129 -
 130
130 -
 131
131 -
 132
132 -
 133
133 -
 134
134 -
 135
135 -
 136
136 -
 137
137 -
 138
138 -
 139
139 -
 140
140 -
 141
141 -
 142
142 -
 143
143 -
144
-
145
-
146
-
147
-
148
-
149
-
150
-
151
-
152
-
153
-
154
-
155
-
156
-
157
-
158
-
159
-
160
-
161
-
162
-
163
-
164
-
165
-
166
-
167
-
168
-
169
-
170
-
171
-
172
-
173
-
174
-
175
-
176
-
177
-
178
-
179
-
180
-
181
-
182
-
183
-
184
-
185
-
186
-
187
-
188
-
189
-
190
-
191
-
192
-
193
-
194
-
195
-
196
-
197
-
198
-
199
-
200
-
201
-
202
-
203
-
204
-
205
-
206
-
207
-
208
-
209
-
210
-
211
-
212
-
213
-
214
-
215
-
216
-
217
-
218
-
219
-
220
-
221
-
222
-
223
-
224
-
225
-
226
-
227
-
228
-
229
-
230
-
231
-
232
-
233
-
234
-
235
-
236
-
237
-
238
-
239
-
240
-
241
-
242
-
243
-
244
-
245
-
246
-
247
-
248
-
249
-
250
-
251
-
252
-
253
-
254
-
255
-
256
-
257
-
258
-
259
-
260
-
261
-
262
-
263
-
264
-
265
-
266
-
267
-
268
-
269
-
270
-
271
-
272
-
273
-
274
-
275
-
276
-
277
-
278
-
279
-
280
-
281
-
282
-
283
-
284
-
285
-
286
-
287
-
288
-
289
-
290
-
291
-
292
-
293
-
294
-
295
-
296
-
297
-
298
-
299
-
300
-
301
-
302
-
303
-
304
-
305
-
306
-
307
-
308
-
309
-
310
-
311
-
312
-
313
-
314
-
315
-
316
-
317
-
318
-
319
-
320
 |
 |

111
Cross-Border Risk
Cross-border risk is the risk that actions taken by a non-U.S. government may
prevent the conversion of local currency into non-local currency and/or the
transfer of funds outside the country, among other risks, thereby impacting
the ability of Citigroup and its customers to transact business across borders.
Examples of cross-border risk include actions taken by foreign governments
such as exchange controls and restrictions on the remittance of funds. These
actions might restrict the transfer of funds or the ability of Citigroup to obtain
payment from customers on their contractual obligations. Management of
cross-border risk at Citi is performed through a formal review process that
includes annual setting of cross-border limits and ongoing monitoring of
cross-border exposures as well as monitoring of economic conditions globally
through Citi’s Global Country Risk Management. See also “Risk Factors—
Market and Economic Risks” above.
Under Federal Financial Institutions Examination Council (FFIEC)
regulatory guidelines, total reported cross-border outstandings include cross-
border claims on third parties, as well as investments in and funding of local
franchises. Cross-border claims on third parties (trade and short-, medium-
and long-term claims) include cross-border loans, securities, deposits with
banks, investments in affiliates, and other monetary assets, as well as net
revaluation gains on foreign exchange and derivative products.
FFIEC cross-border risk measures exposure to the immediate obligors
or counterparties domiciled in the given country or, if applicable, by the
location of collateral or guarantors of the legally binding guarantees.
Cross-border outstandings are reported based on the country of the obligor
or guarantor. Outstandings backed by cash collateral are assigned to the
country in which the collateral is held. For securities received as collateral,
cross-border outstandings are reported in the domicile of the issuer of
the securities. Cross-border resale agreements are presented based on the
domicile of the counterparty.
Investments in and funding of local franchises represent the excess
of local country assets over local country liabilities. Local country assets
are claims on local residents recorded by branches and majority-owned
subsidiaries of Citigroup domiciled in the country, adjusted for externally
guaranteed claims and certain collateral. Local country liabilities are
obligations of non-U.S. branches and majority-owned subsidiaries of
Citigroup for which no cross-border guarantee has been issued by another
Citigroup office.
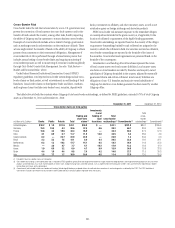
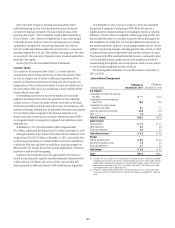
The table below sets forth the countries where Citigroup’s total cross-border outstandings, as defined by FFIEC guidelines, exceeded 0.75% of total Citigroup
assets as of December 31, 2011 and December 31, 2010:
December 31, 2011 $ECEMBERææ
Cross-border claims on third parties
In billions of U.S. dollars Banks Public Private Total
Trading and
short-term
claims (1)
Investments
in and
funding of
local
franchises
Total
cross-border
outstandings (2)
Commitments (3)
4OTALæ
CROSSæ
BORDERæ
OUTSTANDINGSæ #OMMITMENTSæ
æ
5NITEDæ+INGDOM $20.2 $ 1.0 $21.9 $43.1 $38.8 $ — $43.1 $ 101.8
'ERMANY 15.8 18.6 4.2 38.6 37.6 0.6 39.2 64.7
&RANCE 15.6 3.2 19.6 38.4 35.9 — 38.4 69.3 æ
)NDIA 4.1 0.9 6.7 11.7 11.0 18.8 30.5 5.3
#AYMANæ)SLANDS 0.2 — 22.7 22.9 22.5 — 22.9 1.4
"RAZIL 2.3 2.3 7.5 12.1 8.9 8.4 20.5 22.8
.ETHERLANDS 6.2 1.3 10.2 17.7 14.1 0.5 18.2 24.4
-EXICO — 3.0 4.7 7.7 4.7 10.2 17.9 12.3
+OREA 1.9 0.9 3.2 6.0 4.7 9.9 15.9 24.5
3PAIN 4.4 1.0 4.4 9.8 7.4 4.2 14.0 27.7
)TALY 1.5 7.7 1.7 10.9 10.4 0.5 11.4 37.0
æ )NCLUDEDæINæTOTALæCROSSBORDERæCLAIMSæONæTHIRDæPARTIES
æ #ROSSBORDERæOUTSTANDINGSæASæDESCRIBEDæABOVEæANDæASæREQUIREDæBYæ&&)%#æGUIDELINESæGENERALLYæDOæNOTæRECOGNIZEæTHEæBENEFITæOFæMARGINæRECEIVEDæORæHEDGEæPOSITIONSæANDæRECOGNIZEæOFFSETTINGæEXPOSURESæONLYæFORæCERTAINæ
PRODUCTSæANDæRELATIONSHIPSæ!SæAæRESULTæMARKETæVOLATILITYæINæINTERESTæRATESæFOREIGNæEXCHANGEæRATESæANDæCREDITæSPREADSæSUCHæASæEXPERIENCEDæINæTHEæTHIRDæQUARTERæOFææWILLæCAUSEæTHEæLEVELæOFæREPORTEDæCROSSBORDERæ
OUTSTANDINGSæTOæINCREASEæALLæELSEæBEINGæEQUAL
æ #OMMITMENTSæNOTæINCLUDEDæINæTOTALæCROSSBORDERæOUTSTANDINGSæINCLUDEæLEGALLYæBINDINGæCROSSBORDERæLETTERSæOFæCREDITæANDæOTHERæCOMMITMENTSæANDæCONTINGENCIESæASæDEFINEDæBYæTHEæ&&)%#æ4HEæ&&)%#æDEFINITIONæOFæ
COMMITMENTSæINCLUDESæCOMMITMENTSæTOæLOCALæRESIDENTSæTOæBEæFUNDEDæWITHæLOCALæCURRENCYæLIABILITIESæORIGINATEDæWITHINæTHEæCOUNTRY