Citibank 2011 Annual Report Download - page 65
Download and view the complete annual report
Please find page 65 of the 2011 Citibank annual report below. You can navigate through the pages in the report by either clicking on the pages listed below, or by using the keyword search tool below to find specific information within the annual report.-
 1
1 -
2
-
3
-
4
-
5
-
6
-
7
-
8
-
9
-
10
-
11
-
12
-
13
-
14
-
15
-
16
-
17
-
18
-
19
-
20
-
21
-
22
-
23
-
24
-
25
-
26
-
27
-
28
-
29
-
30
-
31
-
32
-
33
-
34
-
35
-
36
-
37
-
38
-
39
-
40
-
41
-
42
-
43
-
44
-
45
-
46
-
47
-
48
-
49
-
50
-
51
-
52
-
53
-
54
-
 55
55 -
 56
56 -
 57
57 -
 58
58 -
 59
59 -
 60
60 -
 61
61 -
 62
62 -
 63
63 -
 64
64 -
 65
65 -
 66
66 -
 67
67 -
 68
68 -
 69
69 -
 70
70 -
 71
71 -
 72
72 -
 73
73 -
 74
74 -
 75
75 -
76
-
77
-
78
-
79
-
80
-
81
-
82
-
83
-
84
-
85
-
86
-
87
-
88
-
89
-
90
-
91
-
92
-
93
-
94
-
95
-
96
-
97
-
98
-
99
-
100
-
101
-
102
-
103
-
104
-
105
-
106
-
107
-
108
-
109
-
110
-
111
-
112
-
113
-
114
-
115
-
116
-
117
-
118
-
119
-
120
-
121
-
122
-
123
-
124
-
125
-
126
-
127
-
128
-
129
-
130
-
131
-
132
-
133
-
134
-
135
-
136
-
137
-
138
-
139
-
140
-
141
-
142
-
143
-
144
-
145
-
146
-
147
-
148
-
149
-
150
-
151
-
152
-
153
-
154
-
155
-
156
-
157
-
158
-
159
-
160
-
161
-
162
-
163
-
164
-
165
-
166
-
167
-
168
-
169
-
170
-
171
-
172
-
173
-
174
-
175
-
176
-
177
-
178
-
179
-
180
-
181
-
182
-
183
-
184
-
185
-
186
-
187
-
188
-
189
-
190
-
191
-
192
-
193
-
194
-
195
-
196
-
197
-
198
-
199
-
200
-
201
-
202
-
203
-
204
-
205
-
206
-
207
-
208
-
209
-
210
-
211
-
212
-
213
-
214
-
215
-
216
-
217
-
218
-
219
-
220
-
221
-
222
-
223
-
224
-
225
-
226
-
227
-
228
-
229
-
230
-
231
-
232
-
233
-
234
-
235
-
236
-
237
-
238
-
239
-
240
-
241
-
242
-
243
-
244
-
245
-
246
-
247
-
248
-
249
-
250
-
251
-
252
-
253
-
254
-
255
-
256
-
257
-
258
-
259
-
260
-
261
-
262
-
263
-
264
-
265
-
266
-
267
-
268
-
269
-
270
-
271
-
272
-
273
-
274
-
275
-
276
-
277
-
278
-
279
-
280
-
281
-
282
-
283
-
284
-
285
-
286
-
287
-
288
-
289
-
290
-
291
-
292
-
293
-
294
-
295
-
296
-
297
-
298
-
299
-
300
-
301
-
302
-
303
-
304
-
305
-
306
-
307
-
308
-
309
-
310
-
311
-
312
-
313
-
314
-
315
-
316
-
317
-
318
-
319
-
320
 |
 |
43
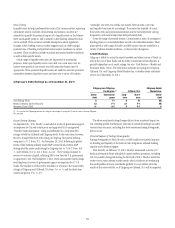
Common Stockholders’ Equity
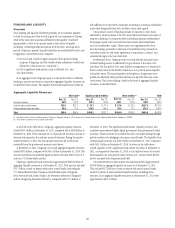
Citigroup’s common stockholders’ equity increased during 2011 by
$14.3 billion to $177.5 billion, and represented 9% of total assets as of
December 31, 2011. The table below summarizes the change in Citigroup’s
common stockholders’ equity during 2011:
In billions of dollars
Common stockholders’ equity, December 31, 2010 $ 163.2
#ITIGROUPSæNETæINCOME 11.1
%MPLOYEEæBENEFITæPLANSæANDæOTHERæACTIVITIESæ 0.9
#ONVERSIONæOFæ!$)!æ5PPERæ$%#SæEQUITYæUNITSæPURCHASEææ
CONTRACTSæTOæCOMMONæSTOCK 3.8
.ETæCHANGEæINæACCUMULATEDæOTHERæCOMPREHENSIVEæINCOMEæLOSSæNETæOFæTAX (1.5)
Common stockholders’ equity, December 31, 2011 $ 177.5
ææ !SæOFæ$ECEMBERææææBILLIONæOFæCOMMONæSTOCKæREPURCHASESæREMAINEDæUNDERæ#ITISæ
AUTHORIZEDæREPURCHASEæPROGRAMSæ.OæMATERIALæREPURCHASESæWEREæMADEæINææ
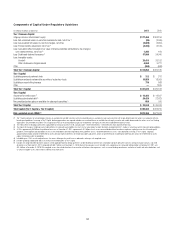
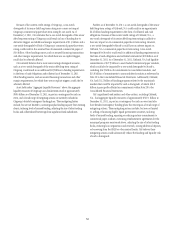
Tangible Common Equity and Tangible Book Value
Per Share
Tangible common equity (TCE), as defined by Citigroup, represents common
equity less goodwill, intangible assets (other than mortgage servicing
rights (MSRs)), and related net deferred tax assets. Other companies may
calculate TCE in a manner different from that of Citigroup. Citi’s TCE was
$145.4 billion at December 31, 2011 and $129.4 billion at December 31, 2010.
The TCE ratio (TCE divided by risk-weighted assets) was 14.9% at
December 31, 2011 and 13.2% at December 31, 2010.
TCE and tangible book value per share, as well as related ratios, are
capital adequacy metrics used and relied upon by investors and industry
analysts; however, they are non-GAAP financial measures for SEC purposes. A
reconciliation of Citigroup’s total stockholders’ equity to TCE, and book value
per share to tangible book value per share, as of December 31, 2011 and
December 31, 2010, follows:
In millions of dollars or shares at year end,
except ratios and per-share data 2011
Total Citigroup stockholders’ equity $ 177,806
,ESS
0REFERREDæSTOCK 312
Common equity $ 177,494
,ESS
'OODWILLæ 25,413
)NTANGIBLEæASSETSæOTHERæTHANæ-32Sæ 6,600
2ELATEDæNETæDEFERREDæTAXæASSETS 44
Tangible common equity (TCE) $ 145,437
Tangible assets
'!!0æASSETSæ $1,873,878
,ESSæ
'OODWILLæ 25,413
)NTANGIBLEæASSETSæOTHERæTHANæ-32Sæ 6,600
2ELATEDæDEFERREDæTAXæASSETS 322
Tangible assets (TA) $1,841,543
Risk-weighted assets (RWA) $ 973,369
TCE/TA ratio 7.90%
TCE/RWA ratio 14.94%
Common shares outstanding (CSO) 2,923.9
Book value per share
(common equity/CSO) $ 60.70
Tangible book value per share (TCE/CSO) $ 49.74