Citibank 2011 Annual Report Download - page 235
Download and view the complete annual report
Please find page 235 of the 2011 Citibank annual report below. You can navigate through the pages in the report by either clicking on the pages listed below, or by using the keyword search tool below to find specific information within the annual report.-
 1
1 -
2
-
3
-
4
-
5
-
6
-
7
-
8
-
9
-
10
-
11
-
12
-
13
-
14
-
15
-
16
-
17
-
18
-
19
-
20
-
21
-
22
-
23
-
24
-
25
-
26
-
27
-
28
-
29
-
30
-
31
-
32
-
33
-
34
-
35
-
36
-
37
-
38
-
39
-
40
-
41
-
42
-
43
-
44
-
45
-
46
-
47
-
48
-
49
-
50
-
51
-
52
-
53
-
54
-
55
-
56
-
57
-
58
-
59
-
60
-
61
-
62
-
63
-
64
-
65
-
66
-
67
-
68
-
69
-
70
-
71
-
72
-
73
-
74
-
75
-
76
-
77
-
78
-
79
-
80
-
81
-
82
-
83
-
84
-
85
-
86
-
87
-
88
-
89
-
90
-
91
-
92
-
93
-
94
-
95
-
96
-
97
-
98
-
99
-
100
-
101
-
102
-
103
-
104
-
105
-
106
-
107
-
108
-
109
-
110
-
111
-
112
-
113
-
114
-
115
-
116
-
117
-
118
-
119
-
120
-
121
-
122
-
123
-
124
-
125
-
126
-
127
-
128
-
129
-
130
-
131
-
132
-
133
-
134
-
135
-
136
-
137
-
138
-
139
-
140
-
141
-
142
-
143
-
144
-
145
-
146
-
147
-
148
-
149
-
150
-
151
-
152
-
153
-
154
-
155
-
156
-
157
-
158
-
159
-
160
-
161
-
162
-
163
-
164
-
165
-
166
-
167
-
168
-
169
-
170
-
171
-
172
-
173
-
174
-
175
-
176
-
177
-
178
-
179
-
180
-
181
-
182
-
183
-
184
-
185
-
186
-
187
-
188
-
189
-
190
-
191
-
192
-
193
-
194
-
195
-
196
-
197
-
198
-
199
-
200
-
201
-
202
-
203
-
204
-
205
-
206
-
207
-
208
-
209
-
210
-
211
-
212
-
213
-
214
-
215
-
216
-
217
-
218
-
219
-
220
-
221
-
222
-
223
-
224
-
 225
225 -
 226
226 -
 227
227 -
 228
228 -
 229
229 -
 230
230 -
 231
231 -
 232
232 -
 233
233 -
 234
234 -
 235
235 -
 236
236 -
 237
237 -
 238
238 -
 239
239 -
 240
240 -
 241
241 -
 242
242 -
 243
243 -
 244
244 -
 245
245 -
246
-
247
-
248
-
249
-
250
-
251
-
252
-
253
-
254
-
255
-
256
-
257
-
258
-
259
-
260
-
261
-
262
-
263
-
264
-
265
-
266
-
267
-
268
-
269
-
270
-
271
-
272
-
273
-
274
-
275
-
276
-
277
-
278
-
279
-
280
-
281
-
282
-
283
-
284
-
285
-
286
-
287
-
288
-
289
-
290
-
291
-
292
-
293
-
294
-
295
-
296
-
297
-
298
-
299
-
300
-
301
-
302
-
303
-
304
-
305
-
306
-
307
-
308
-
309
-
310
-
311
-
312
-
313
-
314
-
315
-
316
-
317
-
318
-
319
-
320
 |
 |

213
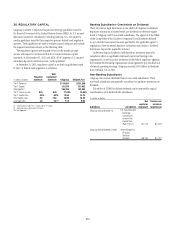
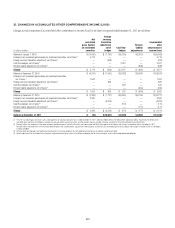
20. REGULATORY CAPITAL
Citigroup is subject to risk-based capital and leverage guidelines issued by
the Board of Governors of the Federal Reserve System (FRB). Its U.S. insured
depository institution subsidiaries, including Citibank, N.A., are subject to
similar guidelines issued by their respective primary federal bank regulatory
agencies. These guidelines are used to evaluate capital adequacy and include
the required minimums shown in the following table.
The regulatory agencies are required by law to take specific prompt
actions with respect to institutions that do not meet minimum capital
standards. As of December 31, 2011 and 2010, all of Citigroup’s U.S. insured
subsidiary depository institutions were “well capitalized.”
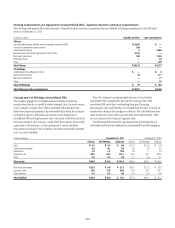
At December 31, 2011, regulatory capital as set forth in guidelines issued
by the U.S. federal bank regulators is as follows:
In millions of dollars
Required
minimum
Well-
capitalized
minimum Citigroup Citibank, N.A.
4IERææ#OMMON $114,854 $121,269
4IERææ#APITAL 131,874 121,862
4OTALæ#APITALæ 165,384 134,284
4IERææ#OMMONæRATIO N/A N/A 11.80% 14.63%
4IERææ#APITALæRATIO 4.0% 6.0% 13.55 14.70
4OTALæ#APITALæRATIO 8.0 10.0 16.99 16.20
,EVERAGEæRATIO 3.0 5.0 (2) 7.19 9.66
æ 4OTALæ#APITALæINCLUDESæ4IERææ#APITALæANDæ4IERææ#APITAL
æ !PPLICABLEæONLYæTOæDEPOSITORYæINSTITUTIONS
.!æ .OTæ!PPLICABLE
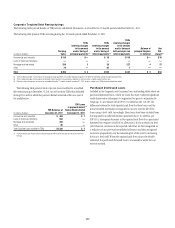
Banking Subsidiaries—Constraints on Dividends
There are various legal limitations on the ability of Citigroup’s subsidiary
depository institutions to extend credit, pay dividends or otherwise supply
funds to Citigroup and its non-bank subsidiaries. The approval of the Office
of the Comptroller of the Currency is required if total dividends declared
in any calendar year exceed amounts specified by the applicable agency’s
regulations. State-chartered depository institutions are subject to dividend
limitations imposed by applicable state law.
In determining the dividends, each depository institution must also
consider its effect on applicable risk-based capital and leverage ratio
requirements, as well as policy statements of the federal regulatory agencies
that indicate that banking organizations should generally pay dividends out
of current operating earnings. Citigroup received $10.9 billion in dividends
from Citibank, N.A. in 2011.
Non-Banking Subsidiaries
Citigroup also receives dividends from its non-bank subsidiaries. These
non-bank subsidiaries are generally not subject to regulatory restrictions on
dividends.
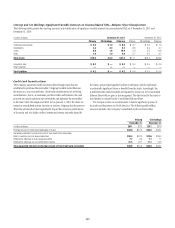
The ability of CGMHI to declare dividends can be restricted by capital
considerations of its broker-dealer subsidiaries.
In millions of dollars
Subsidiary Jurisdiction
Net
capital or
equivalent
Excess over
minimum
requirement
#ITIGROUPæ'LOBALæ-ARKETSæ)NC 53æ3ECURITIESæANDæ
%XCHANGEæ
#OMMISSIONæ
5NIFORMæ.ETæ
#APITALæ2ULEæ
2ULEæC
#ITIGROUPæ'LOBALæ-ARKETSæ,IMITED 5NITEDæ+INGDOMSæ
&INANCIALæ
3ERVICESæ
!UTHORITY