Citibank 2011 Annual Report Download - page 189
Download and view the complete annual report
Please find page 189 of the 2011 Citibank annual report below. You can navigate through the pages in the report by either clicking on the pages listed below, or by using the keyword search tool below to find specific information within the annual report.-
 1
1 -
2
-
3
-
4
-
5
-
6
-
7
-
8
-
9
-
10
-
11
-
12
-
13
-
14
-
15
-
16
-
17
-
18
-
19
-
20
-
21
-
22
-
23
-
24
-
25
-
26
-
27
-
28
-
29
-
30
-
31
-
32
-
33
-
34
-
35
-
36
-
37
-
38
-
39
-
40
-
41
-
42
-
43
-
44
-
45
-
46
-
47
-
48
-
49
-
50
-
51
-
52
-
53
-
54
-
55
-
56
-
57
-
58
-
59
-
60
-
61
-
62
-
63
-
64
-
65
-
66
-
67
-
68
-
69
-
70
-
71
-
72
-
73
-
74
-
75
-
76
-
77
-
78
-
79
-
80
-
81
-
82
-
83
-
84
-
85
-
86
-
87
-
88
-
89
-
90
-
91
-
92
-
93
-
94
-
95
-
96
-
97
-
98
-
99
-
100
-
101
-
102
-
103
-
104
-
105
-
106
-
107
-
108
-
109
-
110
-
111
-
112
-
113
-
114
-
115
-
116
-
117
-
118
-
119
-
120
-
121
-
122
-
123
-
124
-
125
-
126
-
127
-
128
-
129
-
130
-
131
-
132
-
133
-
134
-
135
-
136
-
137
-
138
-
139
-
140
-
141
-
142
-
143
-
144
-
145
-
146
-
147
-
148
-
149
-
150
-
151
-
152
-
153
-
154
-
155
-
156
-
157
-
158
-
159
-
160
-
161
-
162
-
163
-
164
-
165
-
166
-
167
-
168
-
169
-
170
-
171
-
172
-
173
-
174
-
175
-
176
-
177
-
178
-
 179
179 -
 180
180 -
 181
181 -
 182
182 -
 183
183 -
 184
184 -
 185
185 -
 186
186 -
 187
187 -
 188
188 -
 189
189 -
 190
190 -
 191
191 -
 192
192 -
 193
193 -
 194
194 -
 195
195 -
 196
196 -
 197
197 -
 198
198 -
 199
199 -
200
-
201
-
202
-
203
-
204
-
205
-
206
-
207
-
208
-
209
-
210
-
211
-
212
-
213
-
214
-
215
-
216
-
217
-
218
-
219
-
220
-
221
-
222
-
223
-
224
-
225
-
226
-
227
-
228
-
229
-
230
-
231
-
232
-
233
-
234
-
235
-
236
-
237
-
238
-
239
-
240
-
241
-
242
-
243
-
244
-
245
-
246
-
247
-
248
-
249
-
250
-
251
-
252
-
253
-
254
-
255
-
256
-
257
-
258
-
259
-
260
-
261
-
262
-
263
-
264
-
265
-
266
-
267
-
268
-
269
-
270
-
271
-
272
-
273
-
274
-
275
-
276
-
277
-
278
-
279
-
280
-
281
-
282
-
283
-
284
-
285
-
286
-
287
-
288
-
289
-
290
-
291
-
292
-
293
-
294
-
295
-
296
-
297
-
298
-
299
-
300
-
301
-
302
-
303
-
304
-
305
-
306
-
307
-
308
-
309
-
310
-
311
-
312
-
313
-
314
-
315
-
316
-
317
-
318
-
319
-
320
 |
 |

167
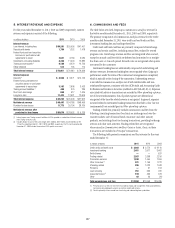
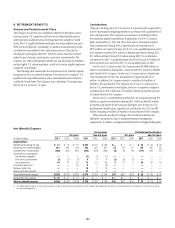
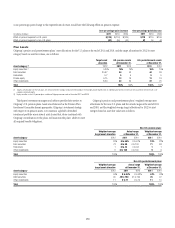
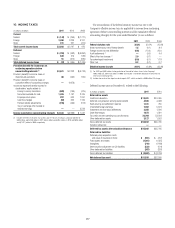
The following table shows the change in Accumulated other
comprehensive income (loss) for the years ended December 31, 2011 and
2010:
In millions of dollars 2011
Balance, January 1, net of tax (1) $(4,105)
!CTUARIALæASSUMPTIONSæCHANGESæANDæPLANæEXPERIENCEæ (820)
.ETæASSETæGAINæDUEæTOæACTUALæRETURNSæ
EXCEEDINGæEXPECTEDæRETURNS 197
.ETæAMORTIZATIONS 183
&OREIGNæEXCHANGEæIMPACTæANDæOTHER 28
#HANGEæINæDEFERREDæTAXESæNET 235
Change, net of tax $ (177) æ
Balance, December 31, net of tax (1) $(4,282)
æ 3EEæ.OTEææTOæTHEæ#ONSOLIDATEDæ&INANCIALæ3TATEMENTSæFORæFURTHERæDISCUSSIONæOFæNETæAccumulated other
comprehensive income (loss)æBALANCE
æ )NCLUDESææMILLIONæANDææMILLIONæINæNETæACTUARIALæLOSSESæRELATEDæTOæ53æNONQUALIFIEDæPENSIONæPLANSæ
FORææANDææRESPECTIVELY
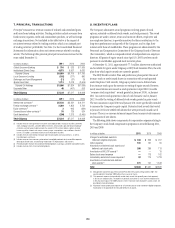
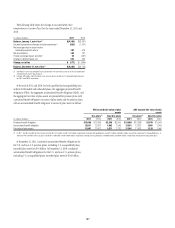
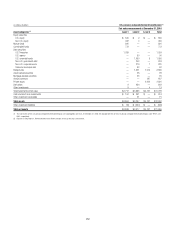
At the end of 2011 and 2010, for both qualified and nonqualified plans
and for both funded and unfunded plans, the aggregate projected benefit
obligation (PBO), the aggregate accumulated benefit obligation (ABO), and
the aggregate fair value of plan assets are presented for pension plans with
a projected benefit obligation in excess of plan assets and for pension plans
with an accumulated benefit obligation in excess of plan assets as follows:
PBO exceeds fair value of plan
assets
ABO exceeds fair value of plan
assets
U.S. plans (1) Non-U.S. plans U.S. plans (1) Non-U.S. plans
In millions of dollars 2011 2011 2011 2011
0ROJECTEDæBENEFITæOBLIGATION $13,089 $2,386 $13,089 $1,970
!CCUMULATEDæBENEFITæOBLIGATIONæ 13,031 1,992 13,031 1,691
&AIRæVALUEæOFæPLANæASSETSæ 11,991 1,671 11,991 1,139
æ )NææTHEæ0"/æANDæ!"/æOFæTHEæ53æPLANSæINCLUDEææMILLIONæANDææMILLIONæRESPECTIVELYæRELATINGæTOæTHEæQUALIFIEDæPLANæANDææMILLIONæANDææMILLIONæRESPECTIVELYæRELATINGæTOæTHEæNONQUALIFIEDæPLANSæ)Næ
æTHEæ0"/æANDæ!"/æOFæTHEæ53æPLANSæINCLUDEææMILLIONæANDææMILLIONæRESPECTIVELYæRELATINGæTOæTHEæQUALIFIEDæPLANæANDææMILLIONæANDææMILLIONæRESPECTIVELYæRELATINGæTOæTHEæNONQUALIFIEDæPLANS
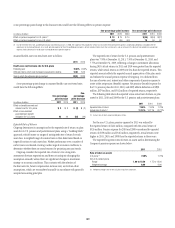
At December 31, 2011, combined accumulated benefit obligations for
the U.S. and non-U.S. pension plans, excluding U.S. nonqualified plans,
exceeded plan assets by $0.6 billion. At December 31, 2010, combined
accumulated benefit obligations for the U.S. and non-U.S. pension plans,
excluding U.S. nonqualified plans, exceeded plan assets by $0.4 billion.