Citibank 2011 Annual Report Download - page 158
Download and view the complete annual report
Please find page 158 of the 2011 Citibank annual report below. You can navigate through the pages in the report by either clicking on the pages listed below, or by using the keyword search tool below to find specific information within the annual report.
136
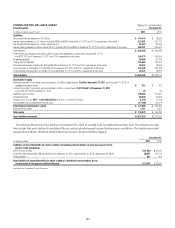
CONSOLIDATED STATEMENT OF CASH FLOWS Citigroup Inc. and Subsidiaries
Year ended December 31,
In millions of dollars 2011
Cash flows from operating activities of continuing operations
Net income (loss) before attribution of noncontrolling interests $ 11,215
Net income attributable to noncontrolling interests 148
Citigroup’s net income (loss) $ 11,067
Income (loss) from discontinued operations, net of taxes 17
Gain (loss) on sale, net of taxes 95
Income (loss) from continuing operations—excluding noncontrolling interests $ 10,955
Adjustments to reconcile net income (loss) to net cash provided by (used in) operating activities of
continuing operations
!MORTIZATIONæOFæDEFERREDæPOLICYæACQUISITIONæCOSTSæANDæPRESENTæVALUEæOFæFUTUREæPROFITS $ 250
!DDITIONSREDUCTIONSæTOæDEFERREDæPOLICYæACQUISITIONæCOSTS (54)
$EPRECIATIONæANDæAMORTIZATION 2,872
$EFERREDæTAXæBENEFIT (74)
0ROVISIONæFORæCREDITæLOSSES 11,824
#HANGEæINæTRADINGæACCOUNTæASSETS 25,538
#HANGEæINæTRADINGæACCOUNTæLIABILITIES (2,972)
#HANGEæINæFEDERALæFUNDSæSOLDæANDæSECURITIESæBORROWEDæORæPURCHASEDæUNDERæAGREEMENTSæTOæRESELL (29,132)
#HANGEæINæFEDERALæFUNDSæPURCHASEDæANDæSECURITIESæLOANEDæORæSOLDæUNDERæAGREEMENTSæTOæREPURCHASE 8,815
#HANGEæINæBROKERAGEæRECEIVABLESæNETæOFæBROKERAGEæPAYABLES 8,383
2EALIZEDæGAINSæFROMæSALESæOFæINVESTMENTS (1,997)
#HANGEæINæLOANSæHELDFORSALE 1,021
/THERæNET 9,312
Total adjustments $ 33,786
Net cash provided by (used in) operating activities of continuing operations $ 44,741
Cash flows from investing activities of continuing operations
#HANGEæINæDEPOSITSæWITHæBANKS $ 6,653
#HANGEæINæLOANS (11,559)
0ROCEEDSæFROMæSALESæANDæSECURITIZATIONSæOFæLOANS 10,022
0URCHASESæOFæINVESTMENTS (314,250)
0ROCEEDSæFROMæSALESæOFæINVESTMENTS 182,566
0ROCEEDSæFROMæMATURITIESæOFæINVESTMENTS 139,959
#APITALæEXPENDITURESæONæPREMISESæANDæEQUIPMENTæANDæCAPITALIZEDæSOFTWARE (3,448)
0ROCEEDSæFROMæSALESæOFæPREMISESæANDæEQUIPMENTæSUBSIDIARIESæANDæAFFILIATESæANDæREPOSSESSEDæASSETS 1,323
Net cash provided by (used in) investing activities of continuing operations $ 11,266
Cash flows from financing activities of continuing operations
$IVIDENDSæPAID $ (107)
)SSUANCEæOFæCOMMONæSTOCK —
)SSUANCESæOFæ4$%#S!0)# —
)SSUANCEæOFæ!$)!æ5PPERæ$ECSæEQUITYæUNITSæPURCHASEæCONTRACT 3,750
4REASURYæSTOCKæACQUIRED (1)
3TOCKæTENDEREDæFORæPAYMENTæOFæWITHHOLDINGæTAXES (230)
)SSUANCEæOFæLONGTERMæDEBT 30,242
0AYMENTSæANDæREDEMPTIONSæOFæLONGTERMæDEBT (89,091)
#HANGEæINæDEPOSITS 23,858
#HANGEæINæSHORTTERMæBORROWINGS (25,067)
Net cash (used in) provided by financing activities of continuing operations $ (56,646)
%FFECTæOFæEXCHANGEæRATEæCHANGESæONæCASHæANDæCASHæEQUIVALENTS $ (1,301)
Discontinued operations
Net cash provided by (used in) discontinued operations $ 2,669
Change in cash and due from banks $ 729
Cash and due from banks at beginning of period 27,972
Cash and due from banks at end of period $ 28,701
Supplemental disclosure of cash flow information for continuing operations
#ASHæPAIDRECEIVEDæDURINGæTHEæYEARæFORæINCOMEæTAXES $ 2,705
#ASHæPAIDæDURINGæTHEæYEARæFORæINTEREST $ 21,230
Non-cash investing activities
4RANSFERSæTOæ/2%/æANDæOTHERæREPOSSESSEDæASSETS $ 1,284
4RANSFERSæTOæTRADINGæACCOUNTæASSETSæFROMæINVESTMENTSæAVAILABLEFORSALEæ —
4RANSFERSæTOæTRADINGæACCOUNTæASSETSæFROMæINVESTMENTSæHELDTOMATURITY $ 12,700
3EEæ.OTESæTOæTHEæ#ONSOLIDATEDæ&INANCIALæ3TATEMENTS


