Citibank 2011 Annual Report Download - page 46
Download and view the complete annual report
Please find page 46 of the 2011 Citibank annual report below. You can navigate through the pages in the report by either clicking on the pages listed below, or by using the keyword search tool below to find specific information within the annual report.-
 1
1 -
2
-
3
-
4
-
5
-
6
-
7
-
8
-
9
-
10
-
11
-
12
-
13
-
14
-
15
-
16
-
17
-
18
-
19
-
20
-
21
-
22
-
23
-
24
-
25
-
26
-
27
-
28
-
29
-
30
-
31
-
32
-
33
-
34
-
35
-
 36
36 -
 37
37 -
 38
38 -
 39
39 -
 40
40 -
 41
41 -
 42
42 -
 43
43 -
 44
44 -
 45
45 -
 46
46 -
 47
47 -
 48
48 -
 49
49 -
 50
50 -
 51
51 -
 52
52 -
 53
53 -
 54
54 -
 55
55 -
 56
56 -
57
-
58
-
59
-
60
-
61
-
62
-
63
-
64
-
65
-
66
-
67
-
68
-
69
-
70
-
71
-
72
-
73
-
74
-
75
-
76
-
77
-
78
-
79
-
80
-
81
-
82
-
83
-
84
-
85
-
86
-
87
-
88
-
89
-
90
-
91
-
92
-
93
-
94
-
95
-
96
-
97
-
98
-
99
-
100
-
101
-
102
-
103
-
104
-
105
-
106
-
107
-
108
-
109
-
110
-
111
-
112
-
113
-
114
-
115
-
116
-
117
-
118
-
119
-
120
-
121
-
122
-
123
-
124
-
125
-
126
-
127
-
128
-
129
-
130
-
131
-
132
-
133
-
134
-
135
-
136
-
137
-
138
-
139
-
140
-
141
-
142
-
143
-
144
-
145
-
146
-
147
-
148
-
149
-
150
-
151
-
152
-
153
-
154
-
155
-
156
-
157
-
158
-
159
-
160
-
161
-
162
-
163
-
164
-
165
-
166
-
167
-
168
-
169
-
170
-
171
-
172
-
173
-
174
-
175
-
176
-
177
-
178
-
179
-
180
-
181
-
182
-
183
-
184
-
185
-
186
-
187
-
188
-
189
-
190
-
191
-
192
-
193
-
194
-
195
-
196
-
197
-
198
-
199
-
200
-
201
-
202
-
203
-
204
-
205
-
206
-
207
-
208
-
209
-
210
-
211
-
212
-
213
-
214
-
215
-
216
-
217
-
218
-
219
-
220
-
221
-
222
-
223
-
224
-
225
-
226
-
227
-
228
-
229
-
230
-
231
-
232
-
233
-
234
-
235
-
236
-
237
-
238
-
239
-
240
-
241
-
242
-
243
-
244
-
245
-
246
-
247
-
248
-
249
-
250
-
251
-
252
-
253
-
254
-
255
-
256
-
257
-
258
-
259
-
260
-
261
-
262
-
263
-
264
-
265
-
266
-
267
-
268
-
269
-
270
-
271
-
272
-
273
-
274
-
275
-
276
-
277
-
278
-
279
-
280
-
281
-
282
-
283
-
284
-
285
-
286
-
287
-
288
-
289
-
290
-
291
-
292
-
293
-
294
-
295
-
296
-
297
-
298
-
299
-
300
-
301
-
302
-
303
-
304
-
305
-
306
-
307
-
308
-
309
-
310
-
311
-
312
-
313
-
314
-
315
-
316
-
317
-
318
-
319
-
320
 |
 |

24
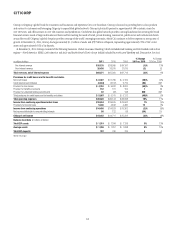
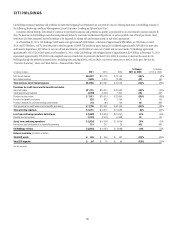
INSTITUTIONAL CLIENTS GROUP
Institutional Clients Group (ICG) includes Securities and Banking and Transaction Services. ICG provides corporate, institutional, public sector and
high-net-worth clients around the world with a full range of products and services, including cash management, foreign exchange, trade finance and services,
securities services, sales and trading, institutional brokerage, underwriting, lending and advisory services. ICG’s international presence is supported by trading
floors in approximately 75 countries and jurisdictions and a proprietary network within Transaction Services in over 95 countries and jurisdictions. At
December 31, 2011, ICG had $979 billion of assets and $484 billion of deposits.
In millions of dollars 2011
% Change
2011 vs. 2010
æ#HANGEæ
æVSæ
#OMMISSIONSæANDæFEES $ 4,447 æ æ 4%
!DMINISTRATIONæANDæOTHERæFIDUCIARYæFEES 2,775 1
)NVESTMENTæBANKING 3,029 (14)
0RINCIPALæTRANSACTIONS 4,873 (12)
/THER 1,817 8
4OTALæNONINTERESTæREVENUE $16,941 (5)%
.ETæINTERESTæREVENUEæINCLUDINGæDIVIDENDS 15,045 (2)
Total revenues, net of interest expense $31,986 (4)%
4OTALæOPERATINGæEXPENSES 20,687 6
.ETæCREDITæLOSSES 619 8
0ROVISIONæRELEASEæFORæUNFUNDEDæLENDINGæCOMMITMENTS 89 NM .-
#REDITæRESERVEæBUILDæRELEASE (556) 11 .-
0ROVISIONSæFORæLOANæLOSSESæANDæBENEFITSæANDæCLAIMSæ $ 152 æ æ NM .-
)NCOMEæFROMæCONTINUINGæOPERATIONSæBEFOREæTAXES $11,147 (18)%
)NCOMEæTAXESæ 2,845 (19)
Income from continuing operations $ 8,302 (18)%
.ETæINCOMEæATTRIBUTABLEæTOæNONCONTROLLINGæINTERESTS 56 (57)
Net income $ 8,246 (18)%
!VERAGEæASSETSæin billions of dollars$ 1,024 æ æ 8%
2ETURNæONæASSETS 0.81%
Revenues by region
North America $10,000 (16)%
EMEA 10,707 5
Latin America 4,069 —
Asia 7,210 2
Total revenues $31,986 (4)%
Income from continuing operations by region
North America $ 1,458 æ æ (51)%
EMEA 3,150 4
Latin America 1,623 (8)
Asia 2,071 (13)
Total income from continuing operations $ 8,302 (18)%
!VERAGEæLOANSæBYæREGIONæin billions of dollars
North America $ 69 æ æ 3%
EMEA 47 24
Latin America 29 26
Asia 52 44
Total average loans $ 197 æ æ 20%
.-æ .OTæMEANINGFUL