Citibank 2011 Annual Report Download - page 59
Download and view the complete annual report
Please find page 59 of the 2011 Citibank annual report below. You can navigate through the pages in the report by either clicking on the pages listed below, or by using the keyword search tool below to find specific information within the annual report.-
 1
1 -
2
-
3
-
4
-
5
-
6
-
7
-
8
-
9
-
10
-
11
-
12
-
13
-
14
-
15
-
16
-
17
-
18
-
19
-
20
-
21
-
22
-
23
-
24
-
25
-
26
-
27
-
28
-
29
-
30
-
31
-
32
-
33
-
34
-
35
-
36
-
37
-
38
-
39
-
40
-
41
-
42
-
43
-
44
-
45
-
46
-
47
-
48
-
 49
49 -
 50
50 -
 51
51 -
 52
52 -
 53
53 -
 54
54 -
 55
55 -
 56
56 -
 57
57 -
 58
58 -
 59
59 -
 60
60 -
 61
61 -
 62
62 -
 63
63 -
 64
64 -
 65
65 -
 66
66 -
 67
67 -
 68
68 -
 69
69 -
70
-
71
-
72
-
73
-
74
-
75
-
76
-
77
-
78
-
79
-
80
-
81
-
82
-
83
-
84
-
85
-
86
-
87
-
88
-
89
-
90
-
91
-
92
-
93
-
94
-
95
-
96
-
97
-
98
-
99
-
100
-
101
-
102
-
103
-
104
-
105
-
106
-
107
-
108
-
109
-
110
-
111
-
112
-
113
-
114
-
115
-
116
-
117
-
118
-
119
-
120
-
121
-
122
-
123
-
124
-
125
-
126
-
127
-
128
-
129
-
130
-
131
-
132
-
133
-
134
-
135
-
136
-
137
-
138
-
139
-
140
-
141
-
142
-
143
-
144
-
145
-
146
-
147
-
148
-
149
-
150
-
151
-
152
-
153
-
154
-
155
-
156
-
157
-
158
-
159
-
160
-
161
-
162
-
163
-
164
-
165
-
166
-
167
-
168
-
169
-
170
-
171
-
172
-
173
-
174
-
175
-
176
-
177
-
178
-
179
-
180
-
181
-
182
-
183
-
184
-
185
-
186
-
187
-
188
-
189
-
190
-
191
-
192
-
193
-
194
-
195
-
196
-
197
-
198
-
199
-
200
-
201
-
202
-
203
-
204
-
205
-
206
-
207
-
208
-
209
-
210
-
211
-
212
-
213
-
214
-
215
-
216
-
217
-
218
-
219
-
220
-
221
-
222
-
223
-
224
-
225
-
226
-
227
-
228
-
229
-
230
-
231
-
232
-
233
-
234
-
235
-
236
-
237
-
238
-
239
-
240
-
241
-
242
-
243
-
244
-
245
-
246
-
247
-
248
-
249
-
250
-
251
-
252
-
253
-
254
-
255
-
256
-
257
-
258
-
259
-
260
-
261
-
262
-
263
-
264
-
265
-
266
-
267
-
268
-
269
-
270
-
271
-
272
-
273
-
274
-
275
-
276
-
277
-
278
-
279
-
280
-
281
-
282
-
283
-
284
-
285
-
286
-
287
-
288
-
289
-
290
-
291
-
292
-
293
-
294
-
295
-
296
-
297
-
298
-
299
-
300
-
301
-
302
-
303
-
304
-
305
-
306
-
307
-
308
-
309
-
310
-
311
-
312
-
313
-
314
-
315
-
316
-
317
-
318
-
319
-
320
 |
 |

37
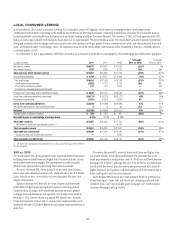
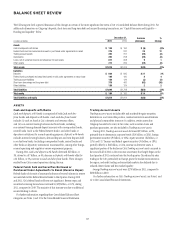
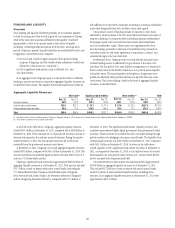
BALANCE SHEET REVIEW
The following sets forth a general discussion of the changes in certain of the more significant line items of Citi’s Consolidated Balance Sheet during 2011. For
additional information on Citigroup’s deposits, short-term and long-term debt and secured financing transactions, see “Capital Resources and Liquidity—
Funding and Liquidity” below.
In billions of dollars
December 31, Increase
(decrease)
%
Change2011
Assets
#ASHæANDæDEPOSITSæWITHæBANKS $ 184 $ (6) (3)%
&EDERALæFUNDSæSOLDæANDæSECURITIESæBORROWEDæORæPURCHASEDæUNDERæAGREEMENTSæTOæRESELLæ 276 29 12
4RADINGæACCOUNTæASSETS 292 (25) (8)
)NVESTMENTS 293 (25) (8)
,OANSæNETæOFæUNEARNEDæINCOMEæANDæALLOWANCEæFORæLOANæLOSSES 617 9 1
/THERæASSETS 212 (22) (9)
Total assets $ 1,874 $(40) (2)%
Liabilities
$EPOSITS $ 866 $21 2%
&EDERALæFUNDSæPURCHASEDæANDæSECURITIESæLOANEDæORæSOLDæUNDERæAGREEMENTSæTOæREPURCHASEæ 198 84
4RADINGæACCOUNTæLIABILITIES 126 (3) (2)
3HORTTERMæBORROWINGSæANDæLONGTERMæDEBT 378 (82) (18)
/THERæLIABILITIES 126 22
Total liabilities $ 1,694 $(54) (3)%
Total equity $ 180 æ $14 8%
Total liabilities and equity $ 1,874 $(40) (2)%
ASSETS
Cash and Deposits with Banks
Cash and deposits with banks is comprised of both Cash and due
from banks and Deposits with banks. Cash and due from banks
includes (i) cash on hand at Citi’s domestic and overseas offices,
and (ii) non-interest-bearing balances due from banks, including
non-interest-bearing demand deposit accounts with correspondent banks,
central banks (such as the Federal Reserve Bank), and other banks or
depository institutions for normal operating purposes. Deposits with banks
includes interest-bearing balances, demand deposits and time deposits held
in or due from banks (including correspondent banks, central banks and
other banks or depository institutions) maintained for, among other things,
normal operating and regulatory reserve requirement purposes.
During 2011, Cash and deposits with banks decreased $6 billion, or
3%, driven by a $7 billion, or 4%, decrease in Deposits with banks offset by
a $1 billion, or 3%, increase in Cash and due from banks. These changes
resulted from Citi’s normal operations during the year.
Federal Funds Sold and Securities Borrowed or
Purchased Under Agreements to Resell (Reverse Repos)
Federal funds sold consist of unsecured advances of excess balances in reserve
accounts held at the Federal Reserve Banks to third parties. During 2010
and 2011, Citi’s federal funds sold were not significant. Reverse repos and
securities borrowing transactions increased by $29 billion, or 12%, during
2011, compared to 2010. The majority of this increase was due to additional
secured lending to clients.
For further information regarding these Consolidated Balance Sheet
categories, see Notes 1 and 12 to the Consolidated Financial Statements.
Trading Account Assets
Trading account assets includes debt and marketable equity securities,
derivatives in a net receivable position, residual interests in securitizations
and physical commodities inventory. In addition, certain assets that
Citigroup has elected to carry at fair value, such as certain loans and
purchase guarantees, are also included in Trading account assets.
During 2011, Trading account assets decreased $25 billion, or 8%,
primarily due to decreases in corporate bonds ($14 billion, or 28%), foreign
government securities ($9 billion, or 10%), equity securities ($4 billion, or
11%) and U.S. Treasury and federal agency securities ($4 billion, or 18%),
partially offset by a $12 billion, or 24%, increase in derivative assets. A
significant portion of the decline in Citi’s Trading account assets occurred in
the second half of 2011 as the economic uncertainty that largely began in the
third quarter of 2011 continued into the fourth quarter. Citi reduced its rates
trading in the G10, particularly in Europe, given the market environment in
the region, and credit trading and securitized markets also declined due to
reduced client volume and less market liquidity.
Average Trading account assets were $270 billion in 2011, compared to
$280 billion in 2010.
For further information on Citi’s Trading account assets, see Notes 1 and
14 to the Consolidated Financial Statements.