Citibank 2011 Annual Report Download - page 187
Download and view the complete annual report
Please find page 187 of the 2011 Citibank annual report below. You can navigate through the pages in the report by either clicking on the pages listed below, or by using the keyword search tool below to find specific information within the annual report.-
 1
1 -
2
-
3
-
4
-
5
-
6
-
7
-
8
-
9
-
10
-
11
-
12
-
13
-
14
-
15
-
16
-
17
-
18
-
19
-
20
-
21
-
22
-
23
-
24
-
25
-
26
-
27
-
28
-
29
-
30
-
31
-
32
-
33
-
34
-
35
-
36
-
37
-
38
-
39
-
40
-
41
-
42
-
43
-
44
-
45
-
46
-
47
-
48
-
49
-
50
-
51
-
52
-
53
-
54
-
55
-
56
-
57
-
58
-
59
-
60
-
61
-
62
-
63
-
64
-
65
-
66
-
67
-
68
-
69
-
70
-
71
-
72
-
73
-
74
-
75
-
76
-
77
-
78
-
79
-
80
-
81
-
82
-
83
-
84
-
85
-
86
-
87
-
88
-
89
-
90
-
91
-
92
-
93
-
94
-
95
-
96
-
97
-
98
-
99
-
100
-
101
-
102
-
103
-
104
-
105
-
106
-
107
-
108
-
109
-
110
-
111
-
112
-
113
-
114
-
115
-
116
-
117
-
118
-
119
-
120
-
121
-
122
-
123
-
124
-
125
-
126
-
127
-
128
-
129
-
130
-
131
-
132
-
133
-
134
-
135
-
136
-
137
-
138
-
139
-
140
-
141
-
142
-
143
-
144
-
145
-
146
-
147
-
148
-
149
-
150
-
151
-
152
-
153
-
154
-
155
-
156
-
157
-
158
-
159
-
160
-
161
-
162
-
163
-
164
-
165
-
166
-
167
-
168
-
169
-
170
-
171
-
172
-
173
-
174
-
175
-
176
-
 177
177 -
 178
178 -
 179
179 -
 180
180 -
 181
181 -
 182
182 -
 183
183 -
 184
184 -
 185
185 -
 186
186 -
 187
187 -
 188
188 -
 189
189 -
 190
190 -
 191
191 -
 192
192 -
 193
193 -
 194
194 -
 195
195 -
 196
196 -
 197
197 -
198
-
199
-
200
-
201
-
202
-
203
-
204
-
205
-
206
-
207
-
208
-
209
-
210
-
211
-
212
-
213
-
214
-
215
-
216
-
217
-
218
-
219
-
220
-
221
-
222
-
223
-
224
-
225
-
226
-
227
-
228
-
229
-
230
-
231
-
232
-
233
-
234
-
235
-
236
-
237
-
238
-
239
-
240
-
241
-
242
-
243
-
244
-
245
-
246
-
247
-
248
-
249
-
250
-
251
-
252
-
253
-
254
-
255
-
256
-
257
-
258
-
259
-
260
-
261
-
262
-
263
-
264
-
265
-
266
-
267
-
268
-
269
-
270
-
271
-
272
-
273
-
274
-
275
-
276
-
277
-
278
-
279
-
280
-
281
-
282
-
283
-
284
-
285
-
286
-
287
-
288
-
289
-
290
-
291
-
292
-
293
-
294
-
295
-
296
-
297
-
298
-
299
-
300
-
301
-
302
-
303
-
304
-
305
-
306
-
307
-
308
-
309
-
310
-
311
-
312
-
313
-
314
-
315
-
316
-
317
-
318
-
319
-
320
 |
 |

165
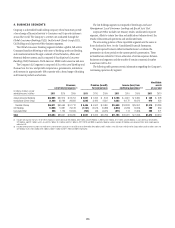
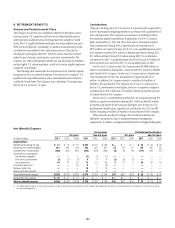
9. RETIREMENT BENEFITS
Pension and Postretirement Plans
The Company has several non-contributory defined benefit pension plans
covering certain U.S. employees and has various defined benefit pension
and termination indemnity plans covering employees outside the United
States. The U.S. qualified defined benefit plan was frozen effective January 1,
2008, for most employees. Accordingly, no additional compensation-based
contributions were credited to the cash balance portion of the plan for
existing plan participants after 2007. However, certain employees covered
under the prior final pay plan formula continue to accrue benefits. The
Company also offers postretirement health care and life insurance benefits to
certain eligible U.S. retired employees, as well as to certain eligible employees
outside the United States.
The following table summarizes the components of net (benefit) expense
recognized in the Consolidated Statement of Income for the Company’s U.S.
qualified and nonqualified pension plans, postretirement plans and plans
outside the United States. The Company uses a December 31 measurement
date for its U.S. and non-U.S. plans.
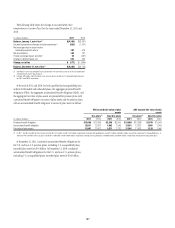
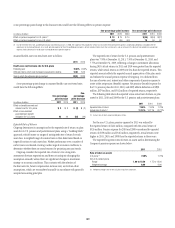
Contributions
Citigroup’s funding policy for U.S. and non-U.S. pension plans is generally to
fund to minimum funding requirements in accordance with applicable local
laws and regulations. The Company may increase its contributions above
the minimum required contribution, if appropriate. For the U.S. pension
plans, at December 31, 2011 and 2010, there were no minimum required
cash contributions. During 2010, a discretionary cash contribution of
$995 million was made to the plan. For the U.S. non-qualified pension plans,
the Company contributed $51 million in benefits paid directly during 2011,
$51 million during 2010 and $55 million during 2009. No contributions
are expected for the U.S. qualified pension plan for 2012 and $53 million of
direct payments are expected for the U.S. non-qualified plans for 2012.
For the non-U.S. pension plans, the Company reported $389 million in
employer contributions during 2011, which includes $47 million in benefits
paid directly by the Company. For the non-U.S. pension plans, discretionary
cash contributions for 2012 are anticipated to be approximately $211
million. In addition, the Company expects to contribute $43 million of
benefits to be paid directly by the Company for its non-U.S. pension plans.
For the U.S. postretirement benefit plans, there are no expected or required
contributions for 2012 other than $55 million of benefit payments expected
to be paid directly by the Company.
For the non-U.S. postretirement benefit plans, the Company reported $75
million in employer contributions during 2011, which includes $5 million
in benefits paid directly by the Company during the year. For the non-U.S.
postretirement benefit plans, expected cash contributions for 2012 are $83
million including $4 million of benefits to be paid directly by the Company.
These estimates are subject to change, since contribution decisions are
affected by various factors, such as market performance and regulatory
requirements. In addition, management has the ability to change funding policy.
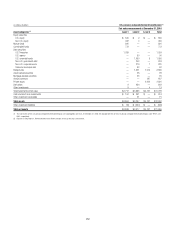
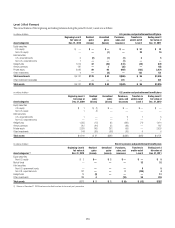
Net (Benefit) Expense
æPension plans Postretirement benefit plans
æU.S. plans Non-U.S. plans U.S. plans Non-U.S. plans
In millions of dollars 2011 2011 2011 2011
Qualified Plans
"ENEFITSæEARNEDæDURINGæTHEæYEAR $13 $ 203 $— $28
)NTERESTæCOSTæONæBENEFITæOBLIGATION 612 382 53 118
%XPECTEDæRETURNæONæPLANæASSETS (890) (422) (6) (117)
!MORTIZATIONæOFæUNRECOGNIZED
.ETæTRANSITIONæOBLIGATION — (1) — —
0RIORæSERVICEæCOSTæBENEFIT (1) 4(3) —
.ETæACTUARIALæLOSS 64 72 3 24
#URTAILMENTæGAINæLOSSæ — 4 — —
3ETTLEMENTæGAINæLOSS —10 — —
3PECIALæTERMINATIONæBENEFITSæ —27 — —
.ETæQUALIFIEDæBENEFITæEXPENSE $(202) $ 279 $47 $53
.ONQUALIFIEDæPLANSæEXPENSE $42 $— $— $—
Total net (benefit) expense $(160) $ 279 $47 $53
æ 4HEææCURTAILMENTæGAINæINæTHEæNON53æPENSIONæPLANSæINCLUDESæANææMILLIONæGAINæREFLECTINGæTHEæSALEæOFæ#ITIGROUPSæ.IKKOæOPERATIONSæ3EEæ.OTEææTOæTHEæ#ONSOLIDATEDæ&INANCIALæ3TATEMENTSæFORæFURTHERæDISCUSSIONæOFæ
THEæSALEæOFæ.IKKOæOPERATIONS