Citibank 2011 Annual Report Download - page 213
Download and view the complete annual report
Please find page 213 of the 2011 Citibank annual report below. You can navigate through the pages in the report by either clicking on the pages listed below, or by using the keyword search tool below to find specific information within the annual report.-
 1
1 -
2
-
3
-
4
-
5
-
6
-
7
-
8
-
9
-
10
-
11
-
12
-
13
-
14
-
15
-
16
-
17
-
18
-
19
-
20
-
21
-
22
-
23
-
24
-
25
-
26
-
27
-
28
-
29
-
30
-
31
-
32
-
33
-
34
-
35
-
36
-
37
-
38
-
39
-
40
-
41
-
42
-
43
-
44
-
45
-
46
-
47
-
48
-
49
-
50
-
51
-
52
-
53
-
54
-
55
-
56
-
57
-
58
-
59
-
60
-
61
-
62
-
63
-
64
-
65
-
66
-
67
-
68
-
69
-
70
-
71
-
72
-
73
-
74
-
75
-
76
-
77
-
78
-
79
-
80
-
81
-
82
-
83
-
84
-
85
-
86
-
87
-
88
-
89
-
90
-
91
-
92
-
93
-
94
-
95
-
96
-
97
-
98
-
99
-
100
-
101
-
102
-
103
-
104
-
105
-
106
-
107
-
108
-
109
-
110
-
111
-
112
-
113
-
114
-
115
-
116
-
117
-
118
-
119
-
120
-
121
-
122
-
123
-
124
-
125
-
126
-
127
-
128
-
129
-
130
-
131
-
132
-
133
-
134
-
135
-
136
-
137
-
138
-
139
-
140
-
141
-
142
-
143
-
144
-
145
-
146
-
147
-
148
-
149
-
150
-
151
-
152
-
153
-
154
-
155
-
156
-
157
-
158
-
159
-
160
-
161
-
162
-
163
-
164
-
165
-
166
-
167
-
168
-
169
-
170
-
171
-
172
-
173
-
174
-
175
-
176
-
177
-
178
-
179
-
180
-
181
-
182
-
183
-
184
-
185
-
186
-
187
-
188
-
189
-
190
-
191
-
192
-
193
-
194
-
195
-
196
-
197
-
198
-
199
-
200
-
201
-
202
-
 203
203 -
 204
204 -
 205
205 -
 206
206 -
 207
207 -
 208
208 -
 209
209 -
 210
210 -
 211
211 -
 212
212 -
 213
213 -
 214
214 -
 215
215 -
 216
216 -
 217
217 -
 218
218 -
 219
219 -
 220
220 -
 221
221 -
 222
222 -
 223
223 -
224
-
225
-
226
-
227
-
228
-
229
-
230
-
231
-
232
-
233
-
234
-
235
-
236
-
237
-
238
-
239
-
240
-
241
-
242
-
243
-
244
-
245
-
246
-
247
-
248
-
249
-
250
-
251
-
252
-
253
-
254
-
255
-
256
-
257
-
258
-
259
-
260
-
261
-
262
-
263
-
264
-
265
-
266
-
267
-
268
-
269
-
270
-
271
-
272
-
273
-
274
-
275
-
276
-
277
-
278
-
279
-
280
-
281
-
282
-
283
-
284
-
285
-
286
-
287
-
288
-
289
-
290
-
291
-
292
-
293
-
294
-
295
-
296
-
297
-
298
-
299
-
300
-
301
-
302
-
303
-
304
-
305
-
306
-
307
-
308
-
309
-
310
-
311
-
312
-
313
-
314
-
315
-
316
-
317
-
318
-
319
-
320
 |
 |

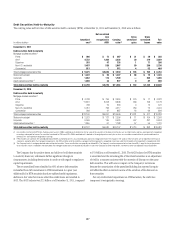
191
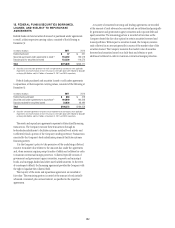
December 31, 2011 and February 23, 2012, foreign currency translation
and related hedges on this equity method investment totaled an additional
cumulative pretax loss of approximately $0.9 billion.
Regarding Citi’s equity method investment in MSSB, Citi has evaluated
this investment for OTTI based on the qualitative and quantitative
measures discussed herein (see also Note 25 to the Consolidated Financial
Statements). As of December 31, 2011, Citi’s carrying value of this equity
method investment was approximately $10 billion. Based on the midpoint
of the current range of estimated values, analysis indicates that a temporary
impairment may exist; however, based on this analysis, the potential
temporary impairment was not material.
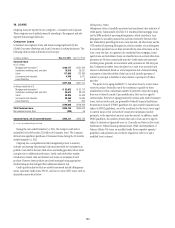
For debt securities that are not deemed to be credit impaired, management
assesses whether it intends to sell or whether it is more-likely-than-not that
it would be required to sell the investment before the expected recovery of
the amortized cost basis. In most cases, management has asserted that it
has no intent to sell and that it believes it is not likely to be required to sell
the investment before recovery of its amortized cost basis. Where such an
assertion cannot be made, the security’s decline in fair value is deemed to be
other than temporary and is recorded in earnings.
For debt securities, a critical component of the evaluation for OTTI is
the identification of credit impaired securities, where management does not
expect to receive cash flows sufficient to recover the entire amortized cost
basis of the security. For securities purchased and classified as AFS with the
expectation of receiving full principal and interest cash flows as of the date of
purchase, this analysis considers the likelihood of receiving all contractual
principal and interest. For securities reclassified out of the trading category in
the fourth quarter of 2008, the analysis considers the likelihood of receiving
the expected principal and interest cash flows anticipated as of the date of
reclassification in the fourth quarter of 2008. The extent of the Company’s
analysis regarding credit quality and the stress on assumptions used in the
analysis have been refined for securities where the current fair value or other
characteristics of the security warrant. The paragraphs below describe the
Company’s process for identifying credit-related impairments in security types
with the most significant unrealized losses as of December 31, 2011.
Mortgage-backed securities
For U.S. mortgage-backed securities (and in particular for Alt-A and other
mortgage-backed securities that have significant unrealized losses as a
percentage of amortized cost), credit impairment is assessed using a cash
flow model that estimates the cash flows on the underlying mortgages, using
the security-specific collateral and transaction structure. The model estimates
cash flows from the underlying mortgage loans and distributes those cash
flows to various tranches of securities, considering the transaction structure
and any subordination and credit enhancements that exist in that structure.
The cash flow model incorporates actual cash flows on the mortgage-backed
securities through the current period and then projects the remaining cash
flows using a number of assumptions, including default rates, prepayment
rates and recovery rates (on foreclosed properties).
Management develops specific assumptions using as much market data
as possible and includes internal estimates as well as estimates published
by rating agencies and other third-party sources. Default rates are projected
by considering current underlying mortgage loan performance, generally
assuming the default of (1) 10% of current loans, (2) 25% of 30–59 day
delinquent loans, (3) 70% of 60–90 day delinquent loans and (4) 100%
of 91+ day delinquent loans. These estimates are extrapolated along a
default timing curve to estimate the total lifetime pool default rate. Other
assumptions used contemplate the actual collateral attributes, including
geographic concentrations, rating agency loss projections, rating actions and
current market prices.
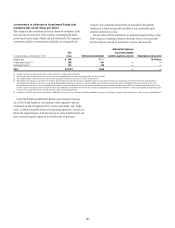
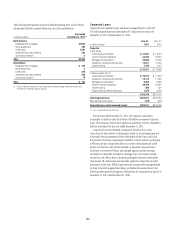
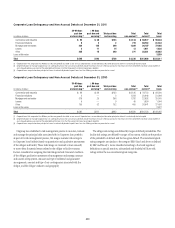
The key assumptions for mortgage-backed securities as of December 31,
2011 are in the table below:
December 31, 2011
0REPAYMENTæRATEæ 1%–8% CRR
,OSSæSEVERITYæ 45%–95%
æ #ONDITIONALæ2EPAYMENTæ2ATEæ#22æREPRESENTSæTHEæANNUALIZEDæEXPECTEDæRATEæOFæVOLUNTARYæPREPAYMENTæ
OFæPRINCIPALæFORæMORTGAGEBACKEDæSECURITIESæOVERæAæCERTAINæPERIODæOFæTIME
æ ,OSSæSEVERITYæRATESæAREæESTIMATEDæCONSIDERINGæCOLLATERALæCHARACTERISTICSæANDæGENERALLYæRANGEæFROMæ
næFORæPRIMEæBONDSænæFORæ!LT!æBONDSæANDænæFORæSUBPRIMEæBONDS
The valuation as of December 31, 2011 assumes that U.S. housing prices
will decrease 4% in 2012, decrease 1% in 2013, remain flat in 2014 and
increase 3% per year from 2015 onwards, while unemployment is 8.9%
for 2012.
In addition, cash flow projections are developed using more stressful
parameters. Management assesses the results of those stress tests (including
the severity of any cash shortfall indicated and the likelihood of the stress
scenarios actually occurring based on the underlying pool’s characteristics
and performance) to assess whether management expects to recover the
amortized cost basis of the security. If cash flow projections indicate that the
Company does not expect to recover its amortized cost basis, the Company
recognizes the estimated credit loss in earnings.
State and municipal securities
Citigroup’s AFS state and municipal bonds consist mainly of bonds that are
financed through Tender Option Bond programs or were previously financed
in this program. The process for identifying credit impairments for these
bonds is largely based on third-party credit ratings. Individual bond positions
are required to meet minimum ratings requirements, which vary based on
the sector of the bond issuer.
Citigroup monitors the bond issuer and insurer ratings on a daily basis.
The average portfolio rating, ignoring any insurance, is Aa3/AA-. In the event
of a downgrade of the bond below Aa3/AA-, the subject bond is specifically
reviewed for potential shortfall in contractual principal and interest. The
remainder of Citigroup’s AFS and HTM state and municipal bonds are
specifically reviewed for credit impairment based on instrument-specific
estimates of cash flows, probability of default and loss given default.
For impaired AFS state and municipal bonds that Citi plans to sell, or
would likely be required to sell and there is no expectation that the fair
value will recover prior to the expected sale date, the full impairment is
recognized in earnings.