Citibank 2011 Annual Report Download - page 30
Download and view the complete annual report
Please find page 30 of the 2011 Citibank annual report below. You can navigate through the pages in the report by either clicking on the pages listed below, or by using the keyword search tool below to find specific information within the annual report.-
 1
1 -
2
-
3
-
4
-
5
-
6
-
7
-
8
-
9
-
10
-
11
-
12
-
13
-
14
-
15
-
16
-
17
-
18
-
19
-
 20
20 -
 21
21 -
 22
22 -
 23
23 -
 24
24 -
 25
25 -
 26
26 -
 27
27 -
 28
28 -
 29
29 -
 30
30 -
 31
31 -
 32
32 -
 33
33 -
 34
34 -
 35
35 -
 36
36 -
 37
37 -
 38
38 -
 39
39 -
 40
40 -
41
-
42
-
43
-
44
-
45
-
46
-
47
-
48
-
49
-
50
-
51
-
52
-
53
-
54
-
55
-
56
-
57
-
58
-
59
-
60
-
61
-
62
-
63
-
64
-
65
-
66
-
67
-
68
-
69
-
70
-
71
-
72
-
73
-
74
-
75
-
76
-
77
-
78
-
79
-
80
-
81
-
82
-
83
-
84
-
85
-
86
-
87
-
88
-
89
-
90
-
91
-
92
-
93
-
94
-
95
-
96
-
97
-
98
-
99
-
100
-
101
-
102
-
103
-
104
-
105
-
106
-
107
-
108
-
109
-
110
-
111
-
112
-
113
-
114
-
115
-
116
-
117
-
118
-
119
-
120
-
121
-
122
-
123
-
124
-
125
-
126
-
127
-
128
-
129
-
130
-
131
-
132
-
133
-
134
-
135
-
136
-
137
-
138
-
139
-
140
-
141
-
142
-
143
-
144
-
145
-
146
-
147
-
148
-
149
-
150
-
151
-
152
-
153
-
154
-
155
-
156
-
157
-
158
-
159
-
160
-
161
-
162
-
163
-
164
-
165
-
166
-
167
-
168
-
169
-
170
-
171
-
172
-
173
-
174
-
175
-
176
-
177
-
178
-
179
-
180
-
181
-
182
-
183
-
184
-
185
-
186
-
187
-
188
-
189
-
190
-
191
-
192
-
193
-
194
-
195
-
196
-
197
-
198
-
199
-
200
-
201
-
202
-
203
-
204
-
205
-
206
-
207
-
208
-
209
-
210
-
211
-
212
-
213
-
214
-
215
-
216
-
217
-
218
-
219
-
220
-
221
-
222
-
223
-
224
-
225
-
226
-
227
-
228
-
229
-
230
-
231
-
232
-
233
-
234
-
235
-
236
-
237
-
238
-
239
-
240
-
241
-
242
-
243
-
244
-
245
-
246
-
247
-
248
-
249
-
250
-
251
-
252
-
253
-
254
-
255
-
256
-
257
-
258
-
259
-
260
-
261
-
262
-
263
-
264
-
265
-
266
-
267
-
268
-
269
-
270
-
271
-
272
-
273
-
274
-
275
-
276
-
277
-
278
-
279
-
280
-
281
-
282
-
283
-
284
-
285
-
286
-
287
-
288
-
289
-
290
-
291
-
292
-
293
-
294
-
295
-
296
-
297
-
298
-
299
-
300
-
301
-
302
-
303
-
304
-
305
-
306
-
307
-
308
-
309
-
310
-
311
-
312
-
313
-
314
-
315
-
316
-
317
-
318
-
319
-
320
 |
 |
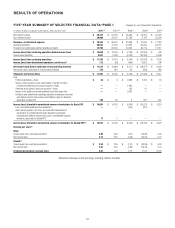
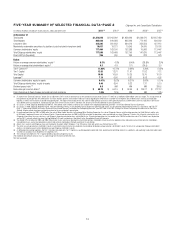
8
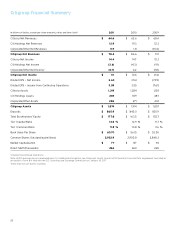
Capital and Loan Loss Reserve Positions
Citigroup’s capital and loan loss reserve positions remained strong at year
end 2011. Citigroup’s Tier 1 Capital ratio was 13.6% and the Tier 1 Common
ratio was 11.8%.
Citigroup’s total allowance for loan losses was $30.1 billion at year end
2011, or 4.7% of total loans, down from $40.7 billion, or 6.3% of total loans,
at the end of the prior year. The decline in the total allowance for loan
losses reflected asset sales, lower non-accrual loans, and overall continued
improvement in the credit quality of Citi’s loan portfolios. The Consumer
allowance for loan losses was $27.2 billion, or 6.45%, of total Consumer
loans at year end 2011, compared to $35.4 billion, or 7.80%, of total
Consumer loans at year end 2010. See details of “Credit Loss Experience—
Allowance for Loan Losses” below for additional information on Citi’s loan
loss coverage ratios as of December 31, 2011.
Citigroup’s non-accrual loans of $11.2 billion at year end 2011 declined
42% from the prior year, and the allowance for loan losses represented 268%
of non-accrual loans.
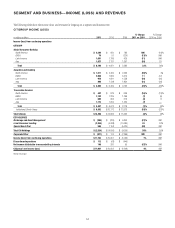
Citicorp
Citicorp net income of $14.4 billion in 2011 decreased by $269 million, or
2%, from the prior year. Excluding CVA/DVA, Citicorp’s net income declined
$1.6 billion, or 10.6%, to $13.4 billion in 2011, reflecting lower revenues and
higher operating expenses, partially offset by the significantly lower credit
costs. Asia and Latin America contributed roughly half of Citicorp’s net
income for the year.
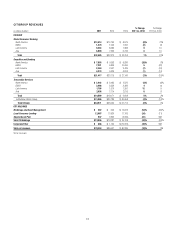
Citicorp revenues were $64.6 billion, down $989 million, or 2%, from
2010. Excluding CVA/DVA, revenues of $62.8 billion were down $3.1 billion,
or 5%, as compared to 2010. Net interest revenues decreased by $450 million,
or 1%, to $38.1 billion, as lower revenues in North America Regional
Consumer Banking and Securities and Banking more than offset growth
in Latin America and Asia Regional Consumer Banking and Transaction
Services. Non-interest revenues, excluding CVA/DVA, declined by $2.7 billion,
or 10%, to $24.7 billion in 2011 as compared to 2010, driven by lower
revenues in Securities and Banking.
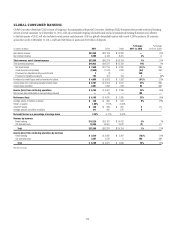
Global Consumer Banking revenues of $32.6 billion were up
$211 million year-over-year, as continued growth in Asia and Latin America
Regional Consumer Banking was partially offset by lower revenues in
North America Regional Consumer Banking. The 2011 results in Global
Consumer Banking included continued momentum in Citi’s international
regions, as well as early signs of growth in its North America business:
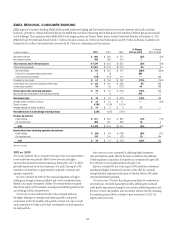
International Regional Consumer Banking revenues of $19.0 billion
were up 8% year-over-year (5% excluding the impact of FX translation).
International average loans were up 15% and average deposits grew 11%
(11% and 8% excluding the impact of FX translation, respectively).
International card purchase sales grew 19% (13% excluding the impact of
FX translation).
Asia achieved positive operating leverage (with year-over-year revenue
growth in excess of expense growth) in the third and fourth quarters of
2011, and Latin America achieved positive operating leverage in the
fourth quarter.
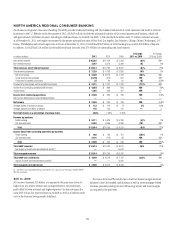
North America Regional Consumer Banking grew revenues, card
accounts and card loans sequentially in the second, third and fourth
quarters of 2011.
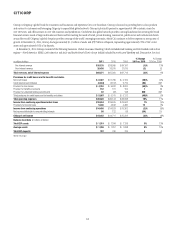
Securities and Banking revenues of $21.4 billion decreased 7% year-
over-year. Excluding CVA/DVA (for details on Securities and Banking CVA/
DVA amounts, see “Institutional Clients Group—Securities and Banking”
below), revenues were $19.7 billion, down 16% from the prior year, due
primarily to the continued challenging macroeconomic environment, which
resulted in lower revenues across fixed income and equity markets as well as
investment banking.
Fixed income markets revenues, which constituted over 50% of Securities
and Banking revenues in 2011, of $10.9 billion, excluding CVA/DVA,
decreased 24% in 2011 as compared to 2010, driven primarily by a decline
in credit-related and securitized products and, to a lesser extent, a decline
in rates and currencies. Equity markets revenues of $2.4 billion, excluding
CVA/DVA, were down 35% year-over-year, mainly driven by weak trading
performance in equity derivatives as well as losses in equity proprietary
trading resulting from the wind down of this business, which was complete
as of December 31, 2011. Investment banking revenues of $3.3 billion
were down 14% in 2011 as compared to 2010, driven by lower market
activity levels across all products. Lending revenues of $1.8 billion were up
$840 million, from $962 million in 2010, primarily due to net hedging gains
of $73 million in 2011, as compared to net hedging losses of $711 million in
2010, driven by spread tightening in Citi’s lending portfolio.
Transaction Services revenues were $10.6 billion in 2011, up 5% from
the prior year, driven by growth in Treasury and Trade Solutions as well as
Securities and Fund Services. Revenues grew in 2011 in all international
regions as strong growth in business volumes was partially offset by
continued spread compression. Average deposits and other customer
liabilities grew 9% in 2011, while assets under custody remained relatively
flat year over year.
Citicorp end of period loans increased 14% in 2011 to $465.4 billion, with
7% growth in Consumer loans and 24% growth in Corporate loans.