Citibank 2011 Annual Report Download - page 104
Download and view the complete annual report
Please find page 104 of the 2011 Citibank annual report below. You can navigate through the pages in the report by either clicking on the pages listed below, or by using the keyword search tool below to find specific information within the annual report.-
 1
1 -
2
-
3
-
4
-
5
-
6
-
7
-
8
-
9
-
10
-
11
-
12
-
13
-
14
-
15
-
16
-
17
-
18
-
19
-
20
-
21
-
22
-
23
-
24
-
25
-
26
-
27
-
28
-
29
-
30
-
31
-
32
-
33
-
34
-
35
-
36
-
37
-
38
-
39
-
40
-
41
-
42
-
43
-
44
-
45
-
46
-
47
-
48
-
49
-
50
-
51
-
52
-
53
-
54
-
55
-
56
-
57
-
58
-
59
-
60
-
61
-
62
-
63
-
64
-
65
-
66
-
67
-
68
-
69
-
70
-
71
-
72
-
73
-
74
-
75
-
76
-
77
-
78
-
79
-
80
-
81
-
82
-
83
-
84
-
85
-
86
-
87
-
88
-
89
-
90
-
91
-
92
-
93
-
 94
94 -
 95
95 -
 96
96 -
 97
97 -
 98
98 -
 99
99 -
 100
100 -
 101
101 -
 102
102 -
 103
103 -
 104
104 -
 105
105 -
 106
106 -
 107
107 -
 108
108 -
 109
109 -
 110
110 -
 111
111 -
 112
112 -
 113
113 -
 114
114 -
115
-
116
-
117
-
118
-
119
-
120
-
121
-
122
-
123
-
124
-
125
-
126
-
127
-
128
-
129
-
130
-
131
-
132
-
133
-
134
-
135
-
136
-
137
-
138
-
139
-
140
-
141
-
142
-
143
-
144
-
145
-
146
-
147
-
148
-
149
-
150
-
151
-
152
-
153
-
154
-
155
-
156
-
157
-
158
-
159
-
160
-
161
-
162
-
163
-
164
-
165
-
166
-
167
-
168
-
169
-
170
-
171
-
172
-
173
-
174
-
175
-
176
-
177
-
178
-
179
-
180
-
181
-
182
-
183
-
184
-
185
-
186
-
187
-
188
-
189
-
190
-
191
-
192
-
193
-
194
-
195
-
196
-
197
-
198
-
199
-
200
-
201
-
202
-
203
-
204
-
205
-
206
-
207
-
208
-
209
-
210
-
211
-
212
-
213
-
214
-
215
-
216
-
217
-
218
-
219
-
220
-
221
-
222
-
223
-
224
-
225
-
226
-
227
-
228
-
229
-
230
-
231
-
232
-
233
-
234
-
235
-
236
-
237
-
238
-
239
-
240
-
241
-
242
-
243
-
244
-
245
-
246
-
247
-
248
-
249
-
250
-
251
-
252
-
253
-
254
-
255
-
256
-
257
-
258
-
259
-
260
-
261
-
262
-
263
-
264
-
265
-
266
-
267
-
268
-
269
-
270
-
271
-
272
-
273
-
274
-
275
-
276
-
277
-
278
-
279
-
280
-
281
-
282
-
283
-
284
-
285
-
286
-
287
-
288
-
289
-
290
-
291
-
292
-
293
-
294
-
295
-
296
-
297
-
298
-
299
-
300
-
301
-
302
-
303
-
304
-
305
-
306
-
307
-
308
-
309
-
310
-
311
-
312
-
313
-
314
-
315
-
316
-
317
-
318
-
319
-
320
 |
 |

82
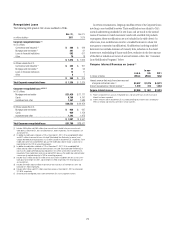
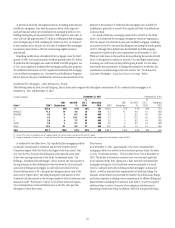
Mortgage Servicing Rights
To minimize credit and liquidity risk, Citi sells most of the mortgage loans
it originates, but retains the servicing rights. These sale transactions create
an intangible asset referred to as mortgage servicing rights (MSRs), which
are recorded at fair value on Citi’s Consolidated Balance Sheet. The fair
value of MSRs is primarily affected by changes in prepayments of mortgages
that result from shifts in mortgage interest rates. Specifically, the fair value
of MSRs declines with increased prepayments, and lower interest rates
are generally one factor that tends to lead to increased prepayments. In
managing this risk, Citi economically hedges a significant portion of the
value of its MSRs through the use of interest rate derivative contracts, forward
purchase commitments of mortgage-backed securities and purchased
securities classified as Trading account assets.
Citi’s MSRs totaled $2.569 billion, $2.852 billion and $4.554 billion at
December 31, 2011, September 30, 2011 and December 31, 2010, respectively.
The decrease in the value of Citi’s MSRs from year end 2010 to year end
2011 primarily represented the impact from lower interest rates in addition
to amortization.
For additional information on Citi’s MSRs, see Note 22 to the Consolidated
Financial Statements.
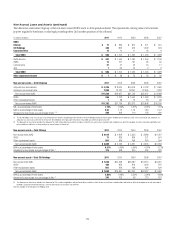
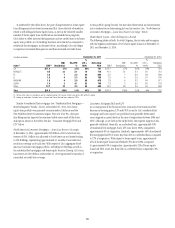
North America Cards
Overview
As of December 31, 2011, Citi’s North America cards portfolio consists
of its Citi-branded portfolio in Citicorp—Global Consumer Banking
and its retail partner cards portfolio in Citi Holdings—Local Consumer
Lending. The substantial majority of the retail partner cards portfolio will
be transferred to Citicorp—NA RCB, effective in the first quarter of 2012 (see
“Executive Summary” and “Citi Holdings” above). As of December 31, 2011,
the Citi-branded portfolio totaled $76 billion, while the retail partner cards
portfolio was $43 billion.
See “Consumer Loan Modification Programs” below for a discussion of
Citi’s significant cards modification programs.
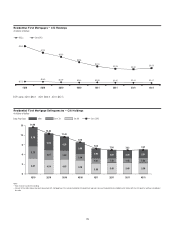
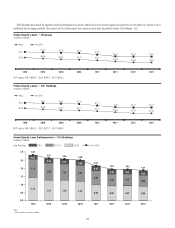
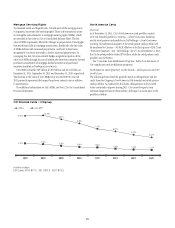
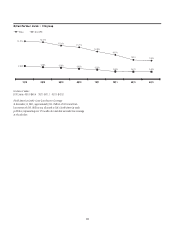
North America Cards Quarterly Credit Trends—Delinquencies and Net
Credit Losses
The following charts detail the quarterly trends in delinquencies and net
credit losses for Citigroup’s North America Citi-branded and retail partner
cards portfolios. As evidenced by the charts, delinquencies and net credit
losses continued to improve during 2011. Citi currently expects some
continued improvement in these metrics, although at a slower pace as the
portfolios stabilize.
1Q10 2Q10 3Q10 4Q10 1Q11 2Q11 3Q11 4Q11
Citi-Branded Cards — Citigroup
In billions of dollars