Citibank 2011 Annual Report Download - page 71
Download and view the complete annual report
Please find page 71 of the 2011 Citibank annual report below. You can navigate through the pages in the report by either clicking on the pages listed below, or by using the keyword search tool below to find specific information within the annual report.-
 1
1 -
2
-
3
-
4
-
5
-
6
-
7
-
8
-
9
-
10
-
11
-
12
-
13
-
14
-
15
-
16
-
17
-
18
-
19
-
20
-
21
-
22
-
23
-
24
-
25
-
26
-
27
-
28
-
29
-
30
-
31
-
32
-
33
-
34
-
35
-
36
-
37
-
38
-
39
-
40
-
41
-
42
-
43
-
44
-
45
-
46
-
47
-
48
-
49
-
50
-
51
-
52
-
53
-
54
-
55
-
56
-
57
-
58
-
59
-
60
-
 61
61 -
 62
62 -
 63
63 -
 64
64 -
 65
65 -
 66
66 -
 67
67 -
 68
68 -
 69
69 -
 70
70 -
 71
71 -
 72
72 -
 73
73 -
 74
74 -
 75
75 -
 76
76 -
 77
77 -
 78
78 -
 79
79 -
 80
80 -
 81
81 -
82
-
83
-
84
-
85
-
86
-
87
-
88
-
89
-
90
-
91
-
92
-
93
-
94
-
95
-
96
-
97
-
98
-
99
-
100
-
101
-
102
-
103
-
104
-
105
-
106
-
107
-
108
-
109
-
110
-
111
-
112
-
113
-
114
-
115
-
116
-
117
-
118
-
119
-
120
-
121
-
122
-
123
-
124
-
125
-
126
-
127
-
128
-
129
-
130
-
131
-
132
-
133
-
134
-
135
-
136
-
137
-
138
-
139
-
140
-
141
-
142
-
143
-
144
-
145
-
146
-
147
-
148
-
149
-
150
-
151
-
152
-
153
-
154
-
155
-
156
-
157
-
158
-
159
-
160
-
161
-
162
-
163
-
164
-
165
-
166
-
167
-
168
-
169
-
170
-
171
-
172
-
173
-
174
-
175
-
176
-
177
-
178
-
179
-
180
-
181
-
182
-
183
-
184
-
185
-
186
-
187
-
188
-
189
-
190
-
191
-
192
-
193
-
194
-
195
-
196
-
197
-
198
-
199
-
200
-
201
-
202
-
203
-
204
-
205
-
206
-
207
-
208
-
209
-
210
-
211
-
212
-
213
-
214
-
215
-
216
-
217
-
218
-
219
-
220
-
221
-
222
-
223
-
224
-
225
-
226
-
227
-
228
-
229
-
230
-
231
-
232
-
233
-
234
-
235
-
236
-
237
-
238
-
239
-
240
-
241
-
242
-
243
-
244
-
245
-
246
-
247
-
248
-
249
-
250
-
251
-
252
-
253
-
254
-
255
-
256
-
257
-
258
-
259
-
260
-
261
-
262
-
263
-
264
-
265
-
266
-
267
-
268
-
269
-
270
-
271
-
272
-
273
-
274
-
275
-
276
-
277
-
278
-
279
-
280
-
281
-
282
-
283
-
284
-
285
-
286
-
287
-
288
-
289
-
290
-
291
-
292
-
293
-
294
-
295
-
296
-
297
-
298
-
299
-
300
-
301
-
302
-
303
-
304
-
305
-
306
-
307
-
308
-
309
-
310
-
311
-
312
-
313
-
314
-
315
-
316
-
317
-
318
-
319
-
320
 |
 |
49
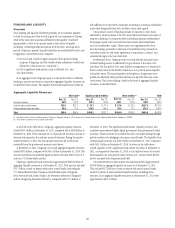
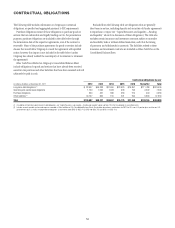
The table below details the long-term debt issuances and maturities of Citigroup during the past three years:
2011
In billions of dollars Maturities Issuances -ATURITIES )SSUANCES -ATURITIES )SSUANCES
,ONGTERMæDEBTæ $50.6 $15.1 æ
,OCALæCOUNTRYæLEVELæ&(,"æANDæOTHER 22.4 15.2 (3)
3ECUREDæDEBTæANDæSECURITIZATIONS 16.1 0.7
Total $89.1 $31.0
æ ,ONGTERMæDEBTæISSUANCESæFORæALLæPERIODSæINæTHEæTABLEæABOVEæREFLECTæ#ITISæSTRUCTURALæLONGTERMæDEBTæISSUANCESæ3TRUCTURALæLONGTERMæDEBTæISæAæNON'!!0æMEASUREæ#ITIæDEFINESæSTRUCTURALæLONGTERMæDEBTæASæITSæLONGTERMæ
DEBTæORIGINALæMATURITIESæOFæONEæYEARæORæMOREæEXCLUDINGæCERTAINæSTRUCTUREDæNOTESæSUCHæASæEQUITYLINKEDæANDæCREDITLINKEDæNOTESæWITHæEARLYæREDEMPTIONæFEATURESæEFFECTIVEæWITHINæONEæYEARæ#ITIGROUPæBELIEVESæTHATæTHEæ
STRUCTURALæLONGTERMæDEBTæMEASUREæPROVIDESæUSEFULæINFORMATIONæTOæITSæINVESTORSæASæITæEXCLUDESæLONGTERMæDEBTæTHATæCOULDæINæFACTæBEæREDEEMEDæBYæTHEæHOLDERSæTHEREOFæWITHINæONEæYEARæ,ONGTERMæDEBTæMATURITIESæFORæALLæ
PERIODSæREFLECTæTHEæTOTALæAMOUNTæOFæSENIORæANDæSUBORDINATEDæLONGTERMæDEBTæANDæTRUSTæPREFERREDæSECURITIESæ
æ $URINGææANDææ#ITIæISSUEDæAæTOTALæOFææBILLIONæOFæSENIORæDEBTæPURSUANTæTOæTHEæREMARKETINGæOFæTHEæTRUSTæPREFERREDæSECURITIESæHELDæBYæ!$)!
æ )NCLUDESææBILLIONæOFæLONGTERMæ&(,"æISSUANCEæINæTHEæFIRSTæQUARTERæOFææANDææBILLIONæINæTHEæSECONDæQUARTERæOFæ
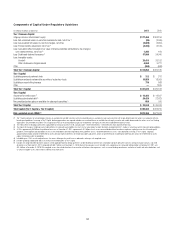
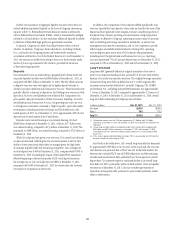
The table below shows Citi’s aggregate expected annual long-term debt maturities as of December 31, 2011:
Expected Long-Term Debt Maturities as of December 31, 2011
In billions of dollars 2012 2013 2014 2015 2016 Thereafter Total
3ENIORSUBORDINATEDæDEBT æ æ æ æ æ æ æ
4RUSTæPREFERREDæSECURITIES
3ECURITIZEDæDEBTæANDæSECURITIZATIONS
,OCALæCOUNTRYæANDæ&(,"æBORROWINGS
Total long-term debt æ æ æ æ æ æ æ
As set forth in the table above, Citi currently estimates its long-term debt
maturing during 2012 to be $60.6 billion (which excludes maturities relating
to local country, securitizations and FHLB), of which $38.0 billion is TLGP
that Citi does not expect to refinance. Given the current status of its liquidity
resources and continued asset reductions in Citi Holdings, Citi currently
expects to refinance approximately $15 billion to $20 billion of long-term
debt during 2012. However, Citi continually reviews its funding and liquidity
needs and may adjust its expected issuances due to market conditions,
including the continued uncertainty resulting from certain European market
concerns, among other factors.
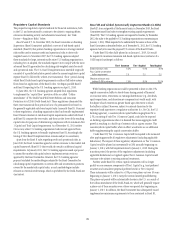
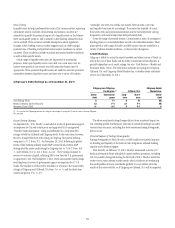
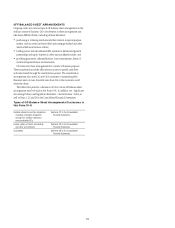
Secured Financing Transactions and Short-Term Borrowings
As referenced above, Citi supplements its primary sources of funding with
short-term borrowings (generally defined as original maturities of less than
one year). Short-term borrowings generally include (i) secured financing
(securities loaned or sold under agreements to repurchase, or repos) and
(ii) short-term borrowings consisting of commercial paper and borrowings
from the FHLB and other market participants. The following table contains
the year-end, average and maximum month-end amounts for the following
respective short-term borrowings categories at the end of each of the three
prior fiscal years.
Federal funds purchased
and securities sold under
agreements to
repurchase
Short-term borrowings (1)
(2) Commercial paper (3) Other short-term borrowings (4)
In billions of dollars 2011 2011 2011
!MOUNTSæOUTSTANDINGæATæYEARæEND $ 198.4 $ 21.3 $33.1
!VERAGEæOUTSTANDINGæDURINGæTHEæYEARæ 219.9 25.3 45.5
-AXIMUMæMONTHENDæOUTSTANDINGæ 226.1 25.3 58.2
Weighted-average interest rate
$URINGæTHEæYEARæ 1.45% 0.28% 1.28%
!TæYEARæENDæ 1.10 0.38 1.09
æ /RIGINALæMATURITIESæOFæLESSæTHANæONEæYEAR
æ 2ATESæREFLECTæPREVAILINGæLOCALæINTERESTæRATESæINCLUDINGæINFLATIONARYæEFFECTSæANDæMONETARYæCORRECTIONæINæCERTAINæCOUNTRIESæ
æ )NCLUDESæCOMMERCIALæPAPERæRELATEDæTOæ6)%SæCONSOLIDATEDæEFFECTIVEæ*ANUARYæææWITHæTHEæADOPTIONæOFæ3&!3æ
æ /THERæSHORTTERMæBORROWINGSæINCLUDEæBROKERæBORROWINGSæANDæBORROWINGSæFROMæBANKSæANDæOTHERæMARKETæPARTICIPANTS
æ %XCLUDESæDISCONTINUEDæOPERATIONSæ7HILEæTHEæANNUALæAVERAGEæBALANCEæISæPRIMARILYæCALCULATEDæFROMæDAILYæBALANCESæINæSOMEæCASESæTHEæAVERAGEæANNUALæBALANCEæISæCALCULATEDæUSINGæAæPOINTæAVERAGEæCOMPOSEDæOFæEACHæOFæ
THEæMONTHENDæBALANCESæDURINGæTHEæYEARæPLUSæTHEæPRIORæYEARENDæENDINGæBALANCEæ
æ )NTERESTæRATESæINCLUDEæTHEæEFFECTSæOFæRISKæMANAGEMENTæACTIVITIESæ3EEæ.OTESææANDææTOæTHEæ#ONSOLIDATEDæ&INANCIALæ3TATEMENTSæ
æ !VERAGEæVOLUMESæOFæSECURITIESæLOANEDæORæSOLDæUNDERæAGREEMENTSæTOæREPURCHASEæAREæREPORTEDæNETæPURSUANTæTOæ&).ææ!3#ææ(OWEVERæINTERESTæEXPENSEæEXCLUDESæTHEæIMPACTæOFæ&).ææ!3#æ
æ "ASEDæONæCONTRACTUALæRATESæATæRESPECTIVEæYEARENDæNONINTERESTBEARINGæACCOUNTSæAREæEXCLUDEDæFROMæTHEæWEIGHTEDæAVERAGEæINTERESTæRATEæCALCULATEDæATæYEAREND