Citibank 2011 Annual Report Download - page 72
Download and view the complete annual report
Please find page 72 of the 2011 Citibank annual report below. You can navigate through the pages in the report by either clicking on the pages listed below, or by using the keyword search tool below to find specific information within the annual report.-
 1
1 -
2
-
3
-
4
-
5
-
6
-
7
-
8
-
9
-
10
-
11
-
12
-
13
-
14
-
15
-
16
-
17
-
18
-
19
-
20
-
21
-
22
-
23
-
24
-
25
-
26
-
27
-
28
-
29
-
30
-
31
-
32
-
33
-
34
-
35
-
36
-
37
-
38
-
39
-
40
-
41
-
42
-
43
-
44
-
45
-
46
-
47
-
48
-
49
-
50
-
51
-
52
-
53
-
54
-
55
-
56
-
57
-
58
-
59
-
60
-
61
-
 62
62 -
 63
63 -
 64
64 -
 65
65 -
 66
66 -
 67
67 -
 68
68 -
 69
69 -
 70
70 -
 71
71 -
 72
72 -
 73
73 -
 74
74 -
 75
75 -
 76
76 -
 77
77 -
 78
78 -
 79
79 -
 80
80 -
 81
81 -
 82
82 -
83
-
84
-
85
-
86
-
87
-
88
-
89
-
90
-
91
-
92
-
93
-
94
-
95
-
96
-
97
-
98
-
99
-
100
-
101
-
102
-
103
-
104
-
105
-
106
-
107
-
108
-
109
-
110
-
111
-
112
-
113
-
114
-
115
-
116
-
117
-
118
-
119
-
120
-
121
-
122
-
123
-
124
-
125
-
126
-
127
-
128
-
129
-
130
-
131
-
132
-
133
-
134
-
135
-
136
-
137
-
138
-
139
-
140
-
141
-
142
-
143
-
144
-
145
-
146
-
147
-
148
-
149
-
150
-
151
-
152
-
153
-
154
-
155
-
156
-
157
-
158
-
159
-
160
-
161
-
162
-
163
-
164
-
165
-
166
-
167
-
168
-
169
-
170
-
171
-
172
-
173
-
174
-
175
-
176
-
177
-
178
-
179
-
180
-
181
-
182
-
183
-
184
-
185
-
186
-
187
-
188
-
189
-
190
-
191
-
192
-
193
-
194
-
195
-
196
-
197
-
198
-
199
-
200
-
201
-
202
-
203
-
204
-
205
-
206
-
207
-
208
-
209
-
210
-
211
-
212
-
213
-
214
-
215
-
216
-
217
-
218
-
219
-
220
-
221
-
222
-
223
-
224
-
225
-
226
-
227
-
228
-
229
-
230
-
231
-
232
-
233
-
234
-
235
-
236
-
237
-
238
-
239
-
240
-
241
-
242
-
243
-
244
-
245
-
246
-
247
-
248
-
249
-
250
-
251
-
252
-
253
-
254
-
255
-
256
-
257
-
258
-
259
-
260
-
261
-
262
-
263
-
264
-
265
-
266
-
267
-
268
-
269
-
270
-
271
-
272
-
273
-
274
-
275
-
276
-
277
-
278
-
279
-
280
-
281
-
282
-
283
-
284
-
285
-
286
-
287
-
288
-
289
-
290
-
291
-
292
-
293
-
294
-
295
-
296
-
297
-
298
-
299
-
300
-
301
-
302
-
303
-
304
-
305
-
306
-
307
-
308
-
309
-
310
-
311
-
312
-
313
-
314
-
315
-
316
-
317
-
318
-
319
-
320
 |
 |

50
Secured Financing Transactions
Secured financing is primarily conducted through Citi’s broker-dealer
subsidiaries to facilitate customer matched-book activity and to efficiently
fund a portion of the trading inventory. As of December 31, 2011, secured
financing was $198 billion and averaged approximately $220 billion during
the year. Secured financing at December 31, 2011 increased year over year by
approximately $9 billion from $190 billion at December 31, 2010.
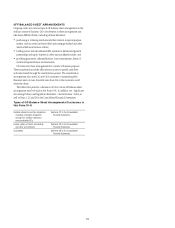
Commercial Paper
At December 31, 2011 and December 31, 2010, commercial paper
outstanding for Citigroup’s non-bank entities and significant bank entities,
respectively, was as follows:
In millions of dollars Dec. 31, 2011 $ECææ
.ONBANKæ $ 6,414
"ANK 14,872 æ
Total $21,286 æ
Other Short-Term Borrowings
At December 31, 2011, Citi’s other short-term borrowings were $33 billion,
compared with $54 billion at December 31, 2010. The average balances for
the quarters were generally consistent with the quarter-end balances for
each period.
See Note 19 to the Consolidated Financial Statements for further
information on Citigroup’s outstanding long-term debt and short-term
borrowings.
Liquidity Risk Management
Liquidity risk is the risk of a financial institution’s inability to meet its
obligations in a timely manner. Management of liquidity risk at Citi is
the responsibility of the Citigroup Treasurer with oversight from senior
management through Citi’s Finance and Asset and Liability Committee
(FinALCO). For additional information on FinALCO and Citi’s liquidity
management, see “Capital Resources – Overview” above.
Citigroup operates under a centralized treasury model where the overall
balance sheet is managed by Citigroup Treasury through Global Franchise
Treasurers and Regional Treasurers. Day-to-day liquidity and funding are
managed by treasurers at the country and business level and are monitored
by Citigroup Treasury and independent risk management.
Liquidity Measures and Stress Testing
Citi uses multiple measures in monitoring its liquidity, including liquidity
ratios, stress testing and liquidity limits, each as described below.
Liquidity Measures
In broad terms, the structural liquidity ratio, defined as the sum of deposits,
long-term debt and stockholders’ equity as a percentage of total assets,
measures whether Citi’s asset base is funded by sufficiently long-dated
liabilities. Citi’s structural liquidity ratio was 73% at December 31, 2011 and
73% at December 31, 2010.
Internally, Citi also utilizes cash capital to measure and monitor its ability
to fund the structurally illiquid portion of the balance sheet, on a specific
product-by-product basis. While cash capital is a methodology generally
used by financial institutions to provide a maturity structure matching
assets and liabilities, there is a lack of standardization in this area and
specific product-by-product assumptions vary by firm. Cash capital measures
the amount of long-term funding—core deposits, long-term debt and
equity—available to fund illiquid assets. Illiquid assets generally include
loans (net of securitization adjustments), securities haircuts and other assets
(i.e., goodwill, intangibles and fixed assets). As of December 31, 2011, based
on Citi’s internal measures, both the non-bank and the aggregate bank
subsidiaries had excess cash capital.
As part of Basel III, the Basel Committee proposed two new liquidity
measurements (for an additional discussion of Basel III, see “Capital
Resources—Regulatory Capital Standards” above). Specifically, as
proposed, the Liquidity Coverage Ratio (LCR) is designed to ensure banking
organizations maintain an adequate level of unencumbered cash and
high quality unencumbered assets that can be converted into cash to meet
liquidity needs. The LCR must be at least 100%, and is proposed to be
effective beginning January 1, 2015. While the U.S. regulators have not yet
provided final rules or guidance with respect to the LCR, based on its current
understanding of the LCR requirements, Citi believes it is in compliance with
the LCR as of December 31, 2011.
In addition to the LCR, the Basel Committee proposed a Net Stable
Funding Ratio (NSFR) designed to promote the medium- and long-term
funding of assets and activities over a one-year time horizon. It is Citi’s
understanding, however, that this proposed metric is under review by the
Basel Committee and may be further revised.
Moreover, in January 2012, the Federal Reserve Board proposed rules to
implement the enhanced prudential standards for systemically important
financial institutions, as required by the Dodd-Frank Act. The proposed
rules include new requirements for liquidity management and corporate
governance related thereto. Citi continues to review these proposed rules and
any potential impact they may have on its liquidity management practices.