Citibank 2011 Annual Report Download - page 70
Download and view the complete annual report
Please find page 70 of the 2011 Citibank annual report below. You can navigate through the pages in the report by either clicking on the pages listed below, or by using the keyword search tool below to find specific information within the annual report.-
 1
1 -
2
-
3
-
4
-
5
-
6
-
7
-
8
-
9
-
10
-
11
-
12
-
13
-
14
-
15
-
16
-
17
-
18
-
19
-
20
-
21
-
22
-
23
-
24
-
25
-
26
-
27
-
28
-
29
-
30
-
31
-
32
-
33
-
34
-
35
-
36
-
37
-
38
-
39
-
40
-
41
-
42
-
43
-
44
-
45
-
46
-
47
-
48
-
49
-
50
-
51
-
52
-
53
-
54
-
55
-
56
-
57
-
58
-
59
-
 60
60 -
 61
61 -
 62
62 -
 63
63 -
 64
64 -
 65
65 -
 66
66 -
 67
67 -
 68
68 -
 69
69 -
 70
70 -
 71
71 -
 72
72 -
 73
73 -
 74
74 -
 75
75 -
 76
76 -
 77
77 -
 78
78 -
 79
79 -
 80
80 -
81
-
82
-
83
-
84
-
85
-
86
-
87
-
88
-
89
-
90
-
91
-
92
-
93
-
94
-
95
-
96
-
97
-
98
-
99
-
100
-
101
-
102
-
103
-
104
-
105
-
106
-
107
-
108
-
109
-
110
-
111
-
112
-
113
-
114
-
115
-
116
-
117
-
118
-
119
-
120
-
121
-
122
-
123
-
124
-
125
-
126
-
127
-
128
-
129
-
130
-
131
-
132
-
133
-
134
-
135
-
136
-
137
-
138
-
139
-
140
-
141
-
142
-
143
-
144
-
145
-
146
-
147
-
148
-
149
-
150
-
151
-
152
-
153
-
154
-
155
-
156
-
157
-
158
-
159
-
160
-
161
-
162
-
163
-
164
-
165
-
166
-
167
-
168
-
169
-
170
-
171
-
172
-
173
-
174
-
175
-
176
-
177
-
178
-
179
-
180
-
181
-
182
-
183
-
184
-
185
-
186
-
187
-
188
-
189
-
190
-
191
-
192
-
193
-
194
-
195
-
196
-
197
-
198
-
199
-
200
-
201
-
202
-
203
-
204
-
205
-
206
-
207
-
208
-
209
-
210
-
211
-
212
-
213
-
214
-
215
-
216
-
217
-
218
-
219
-
220
-
221
-
222
-
223
-
224
-
225
-
226
-
227
-
228
-
229
-
230
-
231
-
232
-
233
-
234
-
235
-
236
-
237
-
238
-
239
-
240
-
241
-
242
-
243
-
244
-
245
-
246
-
247
-
248
-
249
-
250
-
251
-
252
-
253
-
254
-
255
-
256
-
257
-
258
-
259
-
260
-
261
-
262
-
263
-
264
-
265
-
266
-
267
-
268
-
269
-
270
-
271
-
272
-
273
-
274
-
275
-
276
-
277
-
278
-
279
-
280
-
281
-
282
-
283
-
284
-
285
-
286
-
287
-
288
-
289
-
290
-
291
-
292
-
293
-
294
-
295
-
296
-
297
-
298
-
299
-
300
-
301
-
302
-
303
-
304
-
305
-
306
-
307
-
308
-
309
-
310
-
311
-
312
-
313
-
314
-
315
-
316
-
317
-
318
-
319
-
320
 |
 |

48
Further, Citi’s summary of aggregate liquidity resources above does not
include additional potential liquidity in the form of Citigroup’s borrowing
capacity at the U.S. Federal Reserve Bank discount window and from the
various Federal Home Loan Banks (FHLB), which is maintained by pledged
collateral to all such banks. Citi also maintains additional liquidity available
in the form of diversified high grade non-government securities.
In general, Citigroup can freely fund legal entities within its bank
vehicles. In addition, Citigroup’s bank subsidiaries, including Citibank,
N.A., can lend to the Citigroup parent and broker-dealer entities in
accordance with Section 23A of the Federal Reserve Act. As of December 31,
2011, the amount available for lending to these non-bank entities under
Section 23A was approximately $20.4 billion, provided the funds are
collateralized appropriately.
Deposits
Citi continued to focus on maintaining a geographically diverse retail and
corporate deposits base that stood at $866 billion at December 31, 2011, as
compared with $845 billion at December 31, 2010. The $21 billion increase
in deposits year-over-year was largely due to higher deposit volumes in
Global Consumer Banking and Transaction Services. These increases were
partially offset by a decrease in deposits in Citi Holdings year-over-year, while
deposits in Securities and Banking were relatively flat. Compared to the
prior quarter, deposits increased in Global Consumer Banking, Securities
and Banking and Transaction Services. Citi grew deposits year-over-year
in all regions as customers continued a “flight to quality” given the market
environment, including increases in Europe and North America in the
fourth quarter of 2011. As of December 31, 2011, approximately 60% of Citi’s
deposits were located outside of the United States.
Deposits can be interest-bearing or non-interest-bearing. Citi had
$866 billion of deposits at December 31, 2011; of those, $177 billion were
non-interest-bearing, compared to $133 billion at December 31, 2010. The
remainder, or $689 billion, was interest-bearing, compared to $712 billion at
December 31, 2010.
While Citi’s deposits have grown year over year, Citi’s overall cost of funds
on deposits decreased, reflecting the low rate environment as well as Citi’s
ability to lower price points that widens its margins given the high levels
of customer liquidity while still remaining competitive. Citi’s average rate
on total deposits was 0.96% at December 31, 2011, compared with 0.99% at
December 31, 2010. Excluding the impact of the higher FDIC assessment
effective beginning in the second quarter of 2011 and deposit insurance,
the average rate on Citi’s total deposits was 0.80% at December 31, 2011,
compared with 0.86% at December 31, 2010. As interest rates rise, however,
Citi expects to see pressure on these rates.
In addition, the composition of Citi’s deposits shifted significantly year-
over-year. Specifically, time deposits, where rates are fixed for the term of the
deposit and have generally lower margins, became a smaller proportion of
the deposit base, whereas operating accounts became a larger proportion
of deposits. As defined by Citigroup, operating accounts consist of accounts
such as checking and savings accounts for individuals, as well as cash
management accounts for corporations, and, in Citi’s experience, provide
wider margins and exhibit retentive behavior. During 2011, operating
account deposits grew across most of Citi’s deposit-taking businesses,
including retail, the private bank and Transaction Services. Operating
accounts represented 75% of Citicorp’s deposit base as of December 31, 2011,
compared to 70% as of December 31, 2010 and 63% at December 31, 2009.
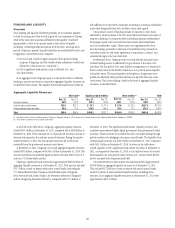
Long-Term Debt
Long-term debt (generally defined as original maturities of one year or
more) is an important funding source, primarily for the non-bank entities,
because of its multi-year maturity structure. The weighted average maturities
of structural long-term debt (as defined in note 1 to the long-term debt
issuances and maturities table below), issued by Citigroup, CFI, CGMHI
and Citibank, N.A., excluding trust preferred securities, was approximately
7.1 years at December 31, 2011, compared to approximately 6.2 years as of
December 31, 2010. At December 31, 2011 and December 31, 2010, overall
long-term debt outstanding for Citigroup was as follows:
In billions of dollars Dec. 31, 2011 $ECæææ
.ONBANKæ $247.0 æ
"ANKæ 76.5 æ
Total (2)(3) $323.5 æ
æ #OLLATERALIZEDæADVANCESæFROMæTHEæ&(,"æWEREæAPPROXIMATELYææBILLIONæANDææBILLIONæ
RESPECTIVELYæATæ$ECEMBERæææANDæ$ECEMBERæææ4HESEæADVANCESæAREæREFLECTEDæINæTHEæ
TABLEæABOVEæ
æ )NCLUDESæLONGTERMæDEBTæRELATEDæTOæCONSOLIDATEDæVARIABLEæINTERESTæENTITIESæ6)%SæOFæAPPROXIMATELYæ
æBILLIONæANDææBILLIONæRESPECTIVELYæATæ$ECEMBERæææANDæ$ECEMBERæææ
4HEæMAJORITYæOFæTHESEæ6)%SæRELATEæTOæTHEæ#ITIBANKæ#REDITæ#ARDæ-ASTERæ4RUSTæANDæTHEæ#ITIBANKæ/-.)æ
-ASTERæ4RUSTæ
æ /FæTHISæAMOUNTæAPPROXIMATELYææBILLIONæMATURINGæINææISæGUARANTEEDæBYæTHEæ&$)#æUNDERæTHEæ
4EMPORARYæ,IQUIDITYæ'UARANTEEæ0ROGRAMæ4,'0
As set forth in the table above, Citi’s overall long-term debt has decreased
by approximately $58 billion year-over-year. In the non-bank, the year-over-
year decrease was primarily due to TLGP run-off. In the bank entities, the
decrease also included TLGP run-off, FHLB reductions, and the maturing
of credit card securitization debt, particularly as Citi has grown its overall
deposit base. Citi currently expects a continued decline in its overall long-
term debt over 2012, particularly within its bank entities. Given its liquidity
resources as of December 31, 2011, Citi may consider opportunities to
repurchase its long-term debt, pursuant to open market purchases, tender
offers or other means.