Citibank 2011 Annual Report Download - page 307
Download and view the complete annual report
Please find page 307 of the 2011 Citibank annual report below. You can navigate through the pages in the report by either clicking on the pages listed below, or by using the keyword search tool below to find specific information within the annual report.-
 1
1 -
2
-
3
-
4
-
5
-
6
-
7
-
8
-
9
-
10
-
11
-
12
-
13
-
14
-
15
-
16
-
17
-
18
-
19
-
20
-
21
-
22
-
23
-
24
-
25
-
26
-
27
-
28
-
29
-
30
-
31
-
32
-
33
-
34
-
35
-
36
-
37
-
38
-
39
-
40
-
41
-
42
-
43
-
44
-
45
-
46
-
47
-
48
-
49
-
50
-
51
-
52
-
53
-
54
-
55
-
56
-
57
-
58
-
59
-
60
-
61
-
62
-
63
-
64
-
65
-
66
-
67
-
68
-
69
-
70
-
71
-
72
-
73
-
74
-
75
-
76
-
77
-
78
-
79
-
80
-
81
-
82
-
83
-
84
-
85
-
86
-
87
-
88
-
89
-
90
-
91
-
92
-
93
-
94
-
95
-
96
-
97
-
98
-
99
-
100
-
101
-
102
-
103
-
104
-
105
-
106
-
107
-
108
-
109
-
110
-
111
-
112
-
113
-
114
-
115
-
116
-
117
-
118
-
119
-
120
-
121
-
122
-
123
-
124
-
125
-
126
-
127
-
128
-
129
-
130
-
131
-
132
-
133
-
134
-
135
-
136
-
137
-
138
-
139
-
140
-
141
-
142
-
143
-
144
-
145
-
146
-
147
-
148
-
149
-
150
-
151
-
152
-
153
-
154
-
155
-
156
-
157
-
158
-
159
-
160
-
161
-
162
-
163
-
164
-
165
-
166
-
167
-
168
-
169
-
170
-
171
-
172
-
173
-
174
-
175
-
176
-
177
-
178
-
179
-
180
-
181
-
182
-
183
-
184
-
185
-
186
-
187
-
188
-
189
-
190
-
191
-
192
-
193
-
194
-
195
-
196
-
197
-
198
-
199
-
200
-
201
-
202
-
203
-
204
-
205
-
206
-
207
-
208
-
209
-
210
-
211
-
212
-
213
-
214
-
215
-
216
-
217
-
218
-
219
-
220
-
221
-
222
-
223
-
224
-
225
-
226
-
227
-
228
-
229
-
230
-
231
-
232
-
233
-
234
-
235
-
236
-
237
-
238
-
239
-
240
-
241
-
242
-
243
-
244
-
245
-
246
-
247
-
248
-
249
-
250
-
251
-
252
-
253
-
254
-
255
-
256
-
257
-
258
-
259
-
260
-
261
-
262
-
263
-
264
-
265
-
266
-
267
-
268
-
269
-
270
-
271
-
272
-
273
-
274
-
275
-
276
-
277
-
278
-
279
-
280
-
281
-
282
-
283
-
284
-
285
-
286
-
287
-
288
-
289
-
290
-
291
-
292
-
293
-
294
-
295
-
296
-
 297
297 -
 298
298 -
 299
299 -
 300
300 -
 301
301 -
 302
302 -
 303
303 -
 304
304 -
 305
305 -
 306
306 -
 307
307 -
 308
308 -
 309
309 -
 310
310 -
 311
311 -
 312
312 -
 313
313 -
 314
314 -
 315
315 -
 316
316 -
 317
317 -
318
-
319
-
320
 |
 |

285
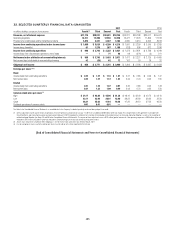
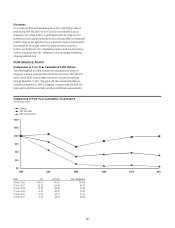
32. SELECTED QUARTERLY FINANCIAL DATA (UNAUDITED)
2011
In millions of dollars, except per share amounts Fourth (1) Third Second First &OURTH 4HIRD 3ECOND &IRST
Revenues, net of interest expense $17,174 $20,831 $20,622 $19,726
/PERATINGæEXPENSES 13,211 12,460 12,936 12,326
0ROVISIONSæFORæCREDITæLOSSESæANDæFORæBENEFITSæANDæCLAIMS 2,874 3,351 3,387 3,184
Income from continuing operations before income taxes $ 1,089 $ 5,020 $ 4,299 $ 4,216
)NCOMEæTAXESæBENEFITS 91 1,278 967 1,185
Income from continuing operations $ 998 $ 3,742 $ 3,332 $ 3,031
)NCOMEæLOSSæFROMæDISCONTINUEDæOPERATIONSæNETæOFæTAXES — 1 71 40
Net income before attribution of noncontrolling interests $ 998 $ 3,743 $ 3,403 $ 3,071
.ETæINCOMEæLOSSæATTRIBUTABLEæTOæNONCONTROLLINGæINTERESTS 42 (28) 62 72
Citigroup’s net income $ 956 $ 3,771 $ 3,341 $ 2,999
Earnings per share (2)(3)
Basic
)NCOMEæLOSSæFROMæCONTINUINGæOPERATIONS $ 0.32 $ 1.27 $ 1.10 $ 1.01
.ETæINCOMEæLOSS 0.32 1.27 1.12 1.02
Diluted
)NCOMEæLOSSæFROMæCONTINUINGæOPERATIONS 0.31 1.23 1.07 0.97
.ETæINCOMEæLOSS 0.31 1.23 1.09 0.99
Common stock price per share (2)
(IGH $ 34.17 $ 42.88 $ 45.90 $ 51.30
,OW 23.11 23.96 36.81 43.90
#LOSE 26.31 25.62 41.64 44.20
$IVIDENDSæPERæSHAREæOFæCOMMONæSTOCK 0.01 0.01 0.01 —
4HISæ.OTEæTOæTHEæ#ONSOLIDATEDæ&INANCIALæ3TATEMENTSæISæUNAUDITEDæDUEæTOæTHEæ#OMPANYSæINDIVIDUALæQUARTERLYæRESULTSæNOTæBEINGæSUBJECTæTOæANæAUDIT
ææ #ITIæHASæADJUSTEDæITSæFOURTHæQUARTERæRESULTSæOFæOPERATIONSæTHATæWEREæPREVIOUSLYæANNOUNCEDæONæ*ANUARYæææFORæANæADDITIONALææMILLIONæAFTERæTAXæCHARGEæ4HISæCHARGEæRELATESæTOæTHEæAGREEMENTæINæPRINCIPLEæWITHæ
THEæ5NITEDæ3TATESæANDæSTATEæATTORNEYSæGENERALæANNOUNCEDæONæ&EBRUARYæææREGARDINGæTHEæSETTLEMENTæOFæAæNUMBERæOFæINVESTIGATIONSæINTOæRESIDENTIALæLOANæSERVICINGæANDæORIGINATIONæLITIGATIONæASæWELLæASæTHEæRESOLUTIONæOFæ
RELATEDæMORTGAGEæLITIGATIONæSEEæ.OTESææANDææTOæTHEæ#ONSOLIDATEDæ&INANCIALæ3TATEMENTSæ4HEæIMPACTæOFæTHESEæADJUSTMENTSæWASæAææMILLIONæPRETAXæINCREASEæINæOther operating expensesæAææMILLIONæAFTERTAXæ
REDUCTIONæINæNet incomeæANDæAææAFTERTAXæREDUCTIONæINæDiluted earnings per shareæEACHæFORæTHEæFOURTHæQUARTERæOFæ
æ !LLæPERæSHAREæAMOUNTSæFORæALLæPERIODSæREFLECTæ#ITIGROUPSæFORæREVERSEæSTOCKæSPLITæWHICHæWASæEFFECTIVEæ-AYææ
æ $UEæTOæAVERAGINGæOFæSHARESæQUARTERLYæEARNINGSæPERæSHAREæMAYæNOTæADDæUPæTOæTHEæTOTALSæREPORTEDæFORæTHEæFULLæYEAR
[End of Consolidated Financial Statements and Notes to Consolidated Financial Statements]