Citibank 2011 Annual Report Download - page 245
Download and view the complete annual report
Please find page 245 of the 2011 Citibank annual report below. You can navigate through the pages in the report by either clicking on the pages listed below, or by using the keyword search tool below to find specific information within the annual report.-
 1
1 -
2
-
3
-
4
-
5
-
6
-
7
-
8
-
9
-
10
-
11
-
12
-
13
-
14
-
15
-
16
-
17
-
18
-
19
-
20
-
21
-
22
-
23
-
24
-
25
-
26
-
27
-
28
-
29
-
30
-
31
-
32
-
33
-
34
-
35
-
36
-
37
-
38
-
39
-
40
-
41
-
42
-
43
-
44
-
45
-
46
-
47
-
48
-
49
-
50
-
51
-
52
-
53
-
54
-
55
-
56
-
57
-
58
-
59
-
60
-
61
-
62
-
63
-
64
-
65
-
66
-
67
-
68
-
69
-
70
-
71
-
72
-
73
-
74
-
75
-
76
-
77
-
78
-
79
-
80
-
81
-
82
-
83
-
84
-
85
-
86
-
87
-
88
-
89
-
90
-
91
-
92
-
93
-
94
-
95
-
96
-
97
-
98
-
99
-
100
-
101
-
102
-
103
-
104
-
105
-
106
-
107
-
108
-
109
-
110
-
111
-
112
-
113
-
114
-
115
-
116
-
117
-
118
-
119
-
120
-
121
-
122
-
123
-
124
-
125
-
126
-
127
-
128
-
129
-
130
-
131
-
132
-
133
-
134
-
135
-
136
-
137
-
138
-
139
-
140
-
141
-
142
-
143
-
144
-
145
-
146
-
147
-
148
-
149
-
150
-
151
-
152
-
153
-
154
-
155
-
156
-
157
-
158
-
159
-
160
-
161
-
162
-
163
-
164
-
165
-
166
-
167
-
168
-
169
-
170
-
171
-
172
-
173
-
174
-
175
-
176
-
177
-
178
-
179
-
180
-
181
-
182
-
183
-
184
-
185
-
186
-
187
-
188
-
189
-
190
-
191
-
192
-
193
-
194
-
195
-
196
-
197
-
198
-
199
-
200
-
201
-
202
-
203
-
204
-
205
-
206
-
207
-
208
-
209
-
210
-
211
-
212
-
213
-
214
-
215
-
216
-
217
-
218
-
219
-
220
-
221
-
222
-
223
-
224
-
225
-
226
-
227
-
228
-
229
-
230
-
231
-
232
-
233
-
234
-
 235
235 -
 236
236 -
 237
237 -
 238
238 -
 239
239 -
 240
240 -
 241
241 -
 242
242 -
 243
243 -
 244
244 -
 245
245 -
 246
246 -
 247
247 -
 248
248 -
 249
249 -
 250
250 -
 251
251 -
 252
252 -
 253
253 -
 254
254 -
 255
255 -
256
-
257
-
258
-
259
-
260
-
261
-
262
-
263
-
264
-
265
-
266
-
267
-
268
-
269
-
270
-
271
-
272
-
273
-
274
-
275
-
276
-
277
-
278
-
279
-
280
-
281
-
282
-
283
-
284
-
285
-
286
-
287
-
288
-
289
-
290
-
291
-
292
-
293
-
294
-
295
-
296
-
297
-
298
-
299
-
300
-
301
-
302
-
303
-
304
-
305
-
306
-
307
-
308
-
309
-
310
-
311
-
312
-
313
-
314
-
315
-
316
-
317
-
318
-
319
-
320
 |
 |

223
The range in the key assumptions is due to the different characteristics
of the interests retained by the Company. The interests retained range
from highly rated and/or senior in the capital structure to unrated and/or
residual interests.
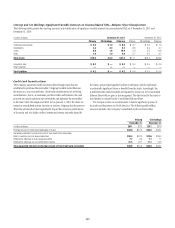
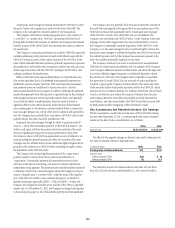
The effect of adverse changes of 10% and 20% in each of the key
assumptions used to determine the fair value of retained interests is disclosed
below. The negative effect of each change is calculated independently,
The Company did not recognize gains (losses) on the securitization
of U.S. agency- and non-agency-sponsored mortgages in the years ended
December 31, 2011 and 2010.
The range in the key assumptions is due to the different characteristics
of the interests retained by the Company. The interests retained range
from highly rated and/or senior in the capital structure to unrated and/or
residual interests.
holding all other assumptions constant. Because the key assumptions may
not in fact be independent, the net effect of simultaneous adverse changes
in the key assumptions may be less than the sum of the individual effects
shown below.
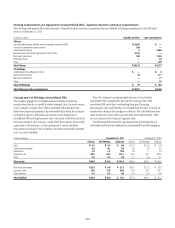
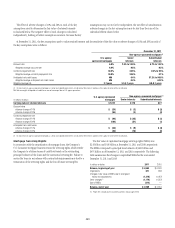
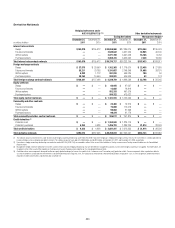
At December 31, 2011, the key assumptions used to value retained interests and the sensitivity of the fair value to adverse changes of 10% and 20% in each of
the key assumptions were as follows:
æDecember 31, 2011
Non-agency-sponsored mortgages (1)
U.S. agency-
sponsored mortgages
Senior
interests
Subordinated
interests
$ISCOUNTæRATE 1.3% to 16.4% 2.2% to 24.4% 1.3% to 28.1%
7EIGHTEDæAVERAGEæDISCOUNTæRATE 8.1% 9.6% 13.5%
#ONSTANTæPREPAYMENTæRATE 18.9% to 30.6% 1.7% to 51.8% 0.6% to 29.1%
7EIGHTEDæAVERAGEæCONSTANTæPREPAYMENTæRATE 28.7% 26.2% 10.5%
!NTICIPATEDæNETæCREDITæLOSSESæ NM 0.0% to 77.9% 29.3% to 90.0%
7EIGHTEDæAVERAGEæANTICIPATEDæNETæCREDITæLOSSES NM 37.6% 57.2%
æ $ISCLOSUREæOFæNONAGENCYSPONSOREDæMORTGAGESæASæSENIORæANDæSUBORDINATEDæINTERESTSæISæINDICATIVEæOFæTHEæINTERESTSæPOSITIONæINæTHEæCAPITALæSTRUCTUREæOFæTHEæSECURITIZATION
æ !NTICIPATEDæNETæCREDITæLOSSESæREPRESENTæESTIMATEDæLOSSæSEVERITYæASSOCIATEDæWITHæDEFAULTEDæMORTGAGEæLOANSæUNDERLYINGæTHEæMORTGAGEæSECURITIZATIONSæDISCLOSEDæABOVEæ!NTICIPATEDæNETæCREDITæLOSSESæINæTHISæINSTANCEæDOæNOTæ
REPRESENTæTOTALæCREDITæLOSSESæINCURREDæTOæDATEæNORæDOæTHEYæREPRESENTæCREDITæLOSSESæEXPECTEDæONæRETAINEDæINTERESTSæINæMORTGAGEæSECURITIZATIONS
.-æ .OTæMEANINGFULæ!NTICIPATEDæNETæCREDITæLOSSESæAREæNOTæMEANINGFULæDUEæTOæ53æAGENCYæGUARANTEES
In millions of dollars
U.S. agency-sponsored
mortgages
Non-agency-sponsored mortgages (1)
Senior interests Subordinated interests
Carrying value of retained interests $ 2,182 $ 88 $ 396
$ISCOUNTæRATES
!DVERSEæCHANGEæOFæ $ (52) $ (3) $ (26)
!DVERSEæCHANGEæOFæ (101) (6) (49)
#ONSTANTæPREPAYMENTæRATE
!DVERSEæCHANGEæOFæ $ (129) $ (6) $ (8)
!DVERSEæCHANGEæOFæ (249) (13) (18)
!NTICIPATEDæNETæCREDITæLOSSES
!DVERSEæCHANGEæOFæ $ (12) $ (2) $ (10)
!DVERSEæCHANGEæOFæ (23) (3) (19)
ææ $ISCLOSUREæOFæNONAGENCYSPONSOREDæMORTGAGESæASæSENIORæANDæSUBORDINATEDæINTERESTSæISæINDICATIVEæOFæTHEæINTERESTSæPOSITIONæINæTHEæCAPITALæSTRUCTUREæOFæTHEæSECURITIZATION
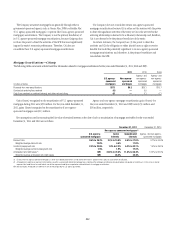
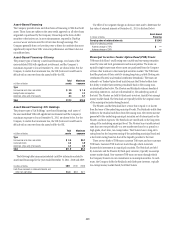
Mortgage Securitizations—Citi Holdings
The following tables summarize selected cash flow information related to Citi Holdings mortgage securitizations for the years ended December 31, 2011, 2010
and 2009:
2011
In billions of dollars
U.S. agency-
sponsored mortgages
Non-agency-
sponsored mortgages
!GENCYæANDææ
NONAGENCYææ
SPONSOREDæMORTGAGES
!GENCYæANDææ
NONAGENCYææ
SPONSOREDæMORTGAGES
0ROCEEDSæFROMæNEWæSECURITIZATIONS $1.1 $ —
#ONTRACTUALæSERVICINGæFEESæRECEIVED 0.5 0.1
#ASHæFLOWSæRECEIVEDæONæRETAINEDæINTERESTSæANDæOTHERæNETæCASHæFLOWS 0.1 —