Citibank 2011 Annual Report Download - page 119
Download and view the complete annual report
Please find page 119 of the 2011 Citibank annual report below. You can navigate through the pages in the report by either clicking on the pages listed below, or by using the keyword search tool below to find specific information within the annual report.-
 1
1 -
2
-
3
-
4
-
5
-
6
-
7
-
8
-
9
-
10
-
11
-
12
-
13
-
14
-
15
-
16
-
17
-
18
-
19
-
20
-
21
-
22
-
23
-
24
-
25
-
26
-
27
-
28
-
29
-
30
-
31
-
32
-
33
-
34
-
35
-
36
-
37
-
38
-
39
-
40
-
41
-
42
-
43
-
44
-
45
-
46
-
47
-
48
-
49
-
50
-
51
-
52
-
53
-
54
-
55
-
56
-
57
-
58
-
59
-
60
-
61
-
62
-
63
-
64
-
65
-
66
-
67
-
68
-
69
-
70
-
71
-
72
-
73
-
74
-
75
-
76
-
77
-
78
-
79
-
80
-
81
-
82
-
83
-
84
-
85
-
86
-
87
-
88
-
89
-
90
-
91
-
92
-
93
-
94
-
95
-
96
-
97
-
98
-
99
-
100
-
101
-
102
-
103
-
104
-
105
-
106
-
107
-
108
-
 109
109 -
 110
110 -
 111
111 -
 112
112 -
 113
113 -
 114
114 -
 115
115 -
 116
116 -
 117
117 -
 118
118 -
 119
119 -
 120
120 -
 121
121 -
 122
122 -
 123
123 -
 124
124 -
 125
125 -
 126
126 -
 127
127 -
 128
128 -
 129
129 -
130
-
131
-
132
-
133
-
134
-
135
-
136
-
137
-
138
-
139
-
140
-
141
-
142
-
143
-
144
-
145
-
146
-
147
-
148
-
149
-
150
-
151
-
152
-
153
-
154
-
155
-
156
-
157
-
158
-
159
-
160
-
161
-
162
-
163
-
164
-
165
-
166
-
167
-
168
-
169
-
170
-
171
-
172
-
173
-
174
-
175
-
176
-
177
-
178
-
179
-
180
-
181
-
182
-
183
-
184
-
185
-
186
-
187
-
188
-
189
-
190
-
191
-
192
-
193
-
194
-
195
-
196
-
197
-
198
-
199
-
200
-
201
-
202
-
203
-
204
-
205
-
206
-
207
-
208
-
209
-
210
-
211
-
212
-
213
-
214
-
215
-
216
-
217
-
218
-
219
-
220
-
221
-
222
-
223
-
224
-
225
-
226
-
227
-
228
-
229
-
230
-
231
-
232
-
233
-
234
-
235
-
236
-
237
-
238
-
239
-
240
-
241
-
242
-
243
-
244
-
245
-
246
-
247
-
248
-
249
-
250
-
251
-
252
-
253
-
254
-
255
-
256
-
257
-
258
-
259
-
260
-
261
-
262
-
263
-
264
-
265
-
266
-
267
-
268
-
269
-
270
-
271
-
272
-
273
-
274
-
275
-
276
-
277
-
278
-
279
-
280
-
281
-
282
-
283
-
284
-
285
-
286
-
287
-
288
-
289
-
290
-
291
-
292
-
293
-
294
-
295
-
296
-
297
-
298
-
299
-
300
-
301
-
302
-
303
-
304
-
305
-
306
-
307
-
308
-
309
-
310
-
311
-
312
-
313
-
314
-
315
-
316
-
317
-
318
-
319
-
320
 |
 |
97
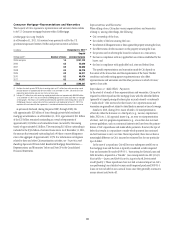
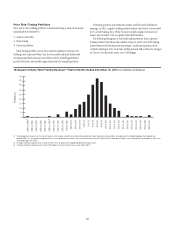
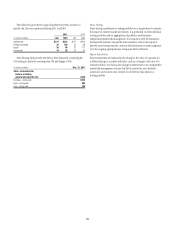
Price Risk—Trading Portfolios
Price risk in Citi’s trading portfolios is monitored using a series of measures,
including but not limited to:
Value at risk (VAR)
Stress testing
Factor sensitivities
Each trading portfolio across Citi’s business segments (Citicorp, Citi
Holdings and Corporate/Other) has its own market risk limit framework
encompassing these measures and other controls, including permitted
product lists and a new product approval process for complex products.
All trading positions are marked to market, with the result reflected in
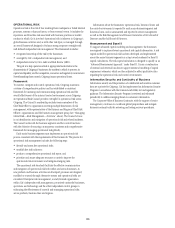
earnings. In 2011, negative trading-related revenue (net losses) was recorded
for 54 of 260 trading days. Of the 54 days on which negative revenue (net
losses) was recorded, 1 day was greater than $180 million.
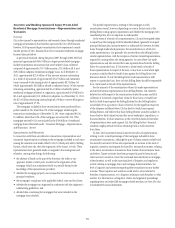
The following histogram of total daily trading revenue (loss) captures
trading volatility and shows the number of days in which Citi’s VAR trading-
related revenues fell within particular ranges. A substantial portion of the
volatility relating to Citi’s total daily trading revenue VAR is driven by changes
in CVA on Citi’s derivative assets, net of CVA hedges.
0
5
10
15
20
25
30
35
40
45
(240) to (220)
(280) to (260)(2)
(260) to (240)
(20) to 0
(40) to (20)
(60) to (40)
(80) to (60)
(100) to (80)
(120) to (100)
(140) to (120)
(160) to (140)
(180) to (160)(3)
(200) to (180)
(220) to (200)
0 to 20
20 to 40
40 to 60
60 to 80
80 to 100
100 to 120
120 to 140
140 to 160
160 to 180
180 to 200
200 to 220
220 to 240
240 to 260
260 to 280
280 to 300
Frequency
Histogram of Daily-Total-Trading Revenue(1)—Twelve Months Ended December 31, 2011
(In millions of dollars)
æ 4OTALæTRADINGæREVENUEæCONSISTSæOFæIæCUSTOMERæREVENUEæWHICHæINCLUDESæSPREADSæFROMæCUSTOMERæFLOWæANDæPOSITIONSæTAKENæTOæFACILITATEæCUSTOMERæORDERSæIIæHEDGINGæACTIVITYæINCLUDINGæHEDGINGæOFæTHEæ#ORPORATEæLOANæ
PORTFOLIOæ-32SæETCæIIIæPROPRIETARYæTRADINGæACTIVITIESæINæCASHæANDæDERIVATIVEæTRANSACTIONSæIVæNETæINTERESTæREVENUEæANDæVæ#6!æADJUSTMENTSæINCURREDæDUEæTOæCHANGESæINæTHEæCREDITæQUALITYæOFæCOUNTERPARTIESæASæWELLæASæANYæ
ASSOCIATEDæHEDGESæTOæTHATæ#6!
æ 0RINCIPALLYæRELATEDæTOæTRADINGæREVENUEæINæICGæONæTHEæDAYæOFæTHEæ53æGOVERNMENTæRATINGæDOWNGRADEæBYæ30æ!UGUSTæ
æ 0RINCIPALLYæRELATEDæTOæTRADINGæREVENUEæINæ)#'æANDæ#6!æHEDGESæONæTHEæDAYæOFæTHEæTSUNAMIæINæ*APANæ-ARCHæ