Citibank 2011 Annual Report Download - page 275
Download and view the complete annual report
Please find page 275 of the 2011 Citibank annual report below. You can navigate through the pages in the report by either clicking on the pages listed below, or by using the keyword search tool below to find specific information within the annual report.-
 1
1 -
2
-
3
-
4
-
5
-
6
-
7
-
8
-
9
-
10
-
11
-
12
-
13
-
14
-
15
-
16
-
17
-
18
-
19
-
20
-
21
-
22
-
23
-
24
-
25
-
26
-
27
-
28
-
29
-
30
-
31
-
32
-
33
-
34
-
35
-
36
-
37
-
38
-
39
-
40
-
41
-
42
-
43
-
44
-
45
-
46
-
47
-
48
-
49
-
50
-
51
-
52
-
53
-
54
-
55
-
56
-
57
-
58
-
59
-
60
-
61
-
62
-
63
-
64
-
65
-
66
-
67
-
68
-
69
-
70
-
71
-
72
-
73
-
74
-
75
-
76
-
77
-
78
-
79
-
80
-
81
-
82
-
83
-
84
-
85
-
86
-
87
-
88
-
89
-
90
-
91
-
92
-
93
-
94
-
95
-
96
-
97
-
98
-
99
-
100
-
101
-
102
-
103
-
104
-
105
-
106
-
107
-
108
-
109
-
110
-
111
-
112
-
113
-
114
-
115
-
116
-
117
-
118
-
119
-
120
-
121
-
122
-
123
-
124
-
125
-
126
-
127
-
128
-
129
-
130
-
131
-
132
-
133
-
134
-
135
-
136
-
137
-
138
-
139
-
140
-
141
-
142
-
143
-
144
-
145
-
146
-
147
-
148
-
149
-
150
-
151
-
152
-
153
-
154
-
155
-
156
-
157
-
158
-
159
-
160
-
161
-
162
-
163
-
164
-
165
-
166
-
167
-
168
-
169
-
170
-
171
-
172
-
173
-
174
-
175
-
176
-
177
-
178
-
179
-
180
-
181
-
182
-
183
-
184
-
185
-
186
-
187
-
188
-
189
-
190
-
191
-
192
-
193
-
194
-
195
-
196
-
197
-
198
-
199
-
200
-
201
-
202
-
203
-
204
-
205
-
206
-
207
-
208
-
209
-
210
-
211
-
212
-
213
-
214
-
215
-
216
-
217
-
218
-
219
-
220
-
221
-
222
-
223
-
224
-
225
-
226
-
227
-
228
-
229
-
230
-
231
-
232
-
233
-
234
-
235
-
236
-
237
-
238
-
239
-
240
-
241
-
242
-
243
-
244
-
245
-
246
-
247
-
248
-
249
-
250
-
251
-
252
-
253
-
254
-
255
-
256
-
257
-
258
-
259
-
260
-
261
-
262
-
263
-
264
-
 265
265 -
 266
266 -
 267
267 -
 268
268 -
 269
269 -
 270
270 -
 271
271 -
 272
272 -
 273
273 -
 274
274 -
 275
275 -
 276
276 -
 277
277 -
 278
278 -
 279
279 -
 280
280 -
 281
281 -
 282
282 -
 283
283 -
 284
284 -
 285
285 -
286
-
287
-
288
-
289
-
290
-
291
-
292
-
293
-
294
-
295
-
296
-
297
-
298
-
299
-
300
-
301
-
302
-
303
-
304
-
305
-
306
-
307
-
308
-
309
-
310
-
311
-
312
-
313
-
314
-
315
-
316
-
317
-
318
-
319
-
320
 |
 |
253
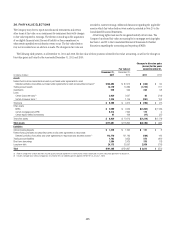
Purchases of asset-backed securities of $5.0 billion and sales of –
$5.9 billion, reflecting trading in CLO and CDO positions.
Transfers of $2.3 billion from Level 2 to Level 3 – , consisting mainly of
transfers of corporate debt securities of $1.5 billion due primarily to
less price transparency for these securities.
Settlements of $5.0 billion – , which included $1.2 billion related
to the scheduled termination of a structured transaction, with
a corresponding decrease in Long-term debt, and $1 billion of
redemptions of auction rate securities.
A net increase in interest rate contracts of $1.5 billion, including transfers
of $1.5 billion from Level 2 to Level 3.
A net decrease in credit derivatives of $0.6 billion. The net decrease was
comprised of gains of $0.5 billion recorded in Principal transactions,
relating mainly to total return swaps referencing returns on corporate
loans, offset by losses on the referenced loans which are classified as Level 2.
Settlements of $1.3 billion related primarily to the settlement of certain
contracts under which the Company had purchased credit protection on
commercial mortgage-backed securities from a single counterparty.
A net decrease in Level 3 Investments of $0.5 billion. There was a net
increase in non-marketable equity securities of $1.4 billion. Purchases of
non-marketable equity securities of $4.9 billion included Citi’s acquisition
of the share capital of Maltby Acquisitions Limited, the holding company
that controls EMI Group Ltd. Purchases also included subscriptions in
Citi-advised private equity and hedge funds. Sales of $1.8 billion and
settlements of $1.7 billion related primarily to sales and redemptions by
the Company of investments in private equity and hedge funds.
A net increase in Loans of $1.5 billion, including transfers from Level 2 to
Level 3 of $0.4 billion, due to a lack of observable prices. Issuances of $2.0 billion
included new margin loans advanced by the Company.
A net decrease in Mortgage servicing rights of $2.0 billion, due to a
reduction in interest rates.
A net decrease in Level 3 Long-term debt of $2.4 billion, which included
settlements of $2.1 billion, $1.2 billion of which related to the scheduled
termination of a structured transaction, with a corresponding decrease in
corporate debt trading securities.
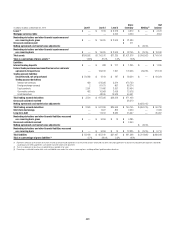
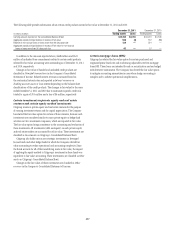
The significant changes from December 31, 2009 to December 31, 2010 in
Level 3 assets and liabilities are due to:
An increase in Federal funds sold and securities borrowed or purchased
under agreements to resell of $3.8 billion, driven primarily by transfers of
certain collateralized long-dated callable reverse repos (structured reverse
repos) of $3.0 billion from Level 2 to Level 3. The Company has noted that
there is more transparency and observability for repo curves (used in the
determination of the fair value of structured reverse repos) with a tenor of five
years or less; thus, structured reverse repos that are expected to mature beyond
the five-year point are generally classified as Level 3. The primary factor driving
the change in expected maturities in structured reverse repo transactions is the
embedded call option feature that enables the investor (the Company) to elect
to terminate the trade early. During 2010, the decrease in interest rates caused
the estimated maturity dates of certain structured reverse repos to lengthen to
more than five years, resulting in the transfer from Level 2 to Level 3.
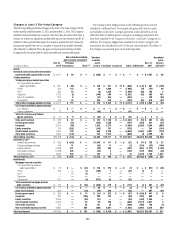
A net decrease in trading securities of $20.8 billion that was driven by:
A net decrease of $10.2 billion in trading mortgage-backed securities –,
driven mainly by liquidations of subprime securities of $7.5 billion
and commercial mortgage-backed securities of $1.8 billion;
A net increase of $3. – 8 billion in asset-backed securities, including
transfers to Level 3 of $5.0 billion. Substantially all of these Level 3
transfers related to the reclassification of certain securities to trading
securities under the fair value option upon adoption of ASU 2010-11
on July 1, 2010, as described in Note 1 to the Consolidated Financial
Statements (for purposes of the Level 3 roll-forward table above, Level 3
investments that were reclassified to trading upon adoption of ASU 2010-
11 have been classified as transfers to Level 3 trading securities); and
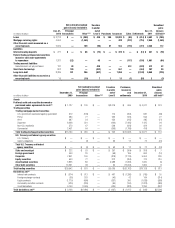
A decrease of $11.9 billion in Other debt securities, due primarily –
to the impact of the consolidation of the credit card securitization
trusts by the Company upon adoption of SFAS 166/167 on January 1,
2010. Upon consolidation of the trusts, the Company recorded the
underlying credit card receivables on its Consolidated Balance Sheet
as Loans accounted for at amortized cost. At January 1, 2010, the
Company’s investments in the trusts and other inter-company
balances were eliminated. At January 1, 2010, the Company’s
investment in these newly consolidated VIEs, which is eliminated
for accounting purposes, included certificates issued by these trusts
of $11.1 billion that were classified as Level 3 at December 31, 2009.
The impact of the elimination of these certificates has been reflected
as net settlements in the Level 3 roll-forward table above.
A net decrease in Derivatives of $4.0 billion, including net trading losses
of $1.5 billion, net settlements of $1.9 billion and net transfers out of
Level 3 to Level 2 of $0.6 billion.
A net decrease in Level 3 Investments of $4.1 billion, including net sales
of asset-backed securities of $2.6 billion and sales of non-marketable
equity securities of $1.1 billion.
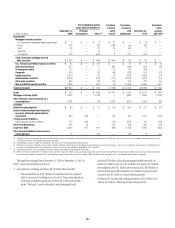
A net increase in Loans of $3 billion, due largely to the Company’s
consolidation of certain VIEs upon the adoption of SFAS 167 on
January 1, 2010, for which the fair value option was elected. The impact
from consolidation of these VIEs on Level 3 loans has been reflected as
purchases in the Level 3 roll-forward above.
A decrease in Mortgage servicing rights of $2 billion due primarily to
losses of $1.1 billion, resulting from a reduction in interest rates.
A decrease in Long-term debt of $1.3 billion, driven mainly by $1.3
billion of net terminations of structured notes.