Citibank 2011 Annual Report Download - page 118
Download and view the complete annual report
Please find page 118 of the 2011 Citibank annual report below. You can navigate through the pages in the report by either clicking on the pages listed below, or by using the keyword search tool below to find specific information within the annual report.-
 1
1 -
2
-
3
-
4
-
5
-
6
-
7
-
8
-
9
-
10
-
11
-
12
-
13
-
14
-
15
-
16
-
17
-
18
-
19
-
20
-
21
-
22
-
23
-
24
-
25
-
26
-
27
-
28
-
29
-
30
-
31
-
32
-
33
-
34
-
35
-
36
-
37
-
38
-
39
-
40
-
41
-
42
-
43
-
44
-
45
-
46
-
47
-
48
-
49
-
50
-
51
-
52
-
53
-
54
-
55
-
56
-
57
-
58
-
59
-
60
-
61
-
62
-
63
-
64
-
65
-
66
-
67
-
68
-
69
-
70
-
71
-
72
-
73
-
74
-
75
-
76
-
77
-
78
-
79
-
80
-
81
-
82
-
83
-
84
-
85
-
86
-
87
-
88
-
89
-
90
-
91
-
92
-
93
-
94
-
95
-
96
-
97
-
98
-
99
-
100
-
101
-
102
-
103
-
104
-
105
-
106
-
107
-
 108
108 -
 109
109 -
 110
110 -
 111
111 -
 112
112 -
 113
113 -
 114
114 -
 115
115 -
 116
116 -
 117
117 -
 118
118 -
 119
119 -
 120
120 -
 121
121 -
 122
122 -
 123
123 -
 124
124 -
 125
125 -
 126
126 -
 127
127 -
 128
128 -
129
-
130
-
131
-
132
-
133
-
134
-
135
-
136
-
137
-
138
-
139
-
140
-
141
-
142
-
143
-
144
-
145
-
146
-
147
-
148
-
149
-
150
-
151
-
152
-
153
-
154
-
155
-
156
-
157
-
158
-
159
-
160
-
161
-
162
-
163
-
164
-
165
-
166
-
167
-
168
-
169
-
170
-
171
-
172
-
173
-
174
-
175
-
176
-
177
-
178
-
179
-
180
-
181
-
182
-
183
-
184
-
185
-
186
-
187
-
188
-
189
-
190
-
191
-
192
-
193
-
194
-
195
-
196
-
197
-
198
-
199
-
200
-
201
-
202
-
203
-
204
-
205
-
206
-
207
-
208
-
209
-
210
-
211
-
212
-
213
-
214
-
215
-
216
-
217
-
218
-
219
-
220
-
221
-
222
-
223
-
224
-
225
-
226
-
227
-
228
-
229
-
230
-
231
-
232
-
233
-
234
-
235
-
236
-
237
-
238
-
239
-
240
-
241
-
242
-
243
-
244
-
245
-
246
-
247
-
248
-
249
-
250
-
251
-
252
-
253
-
254
-
255
-
256
-
257
-
258
-
259
-
260
-
261
-
262
-
263
-
264
-
265
-
266
-
267
-
268
-
269
-
270
-
271
-
272
-
273
-
274
-
275
-
276
-
277
-
278
-
279
-
280
-
281
-
282
-
283
-
284
-
285
-
286
-
287
-
288
-
289
-
290
-
291
-
292
-
293
-
294
-
295
-
296
-
297
-
298
-
299
-
300
-
301
-
302
-
303
-
304
-
305
-
306
-
307
-
308
-
309
-
310
-
311
-
312
-
313
-
314
-
315
-
316
-
317
-
318
-
319
-
320
 |
 |

96
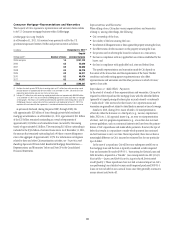
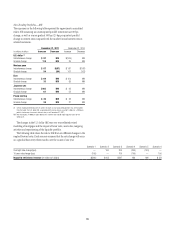
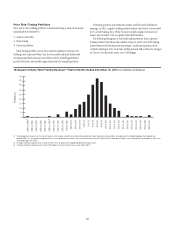
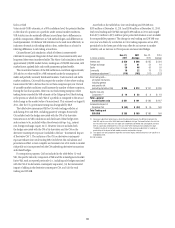
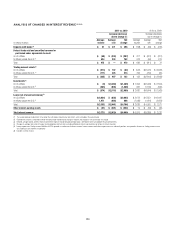
Non-Trading Portfolios—IRE
The exposures in the following table represent the approximate annualized
risk to NIR assuming an unanticipated parallel instantaneous 100 bps
change, as well as a more gradual 100 bps (25 bps per quarter) parallel
change in interest rates compared with the market forward interest rates in
selected currencies.
December 31, 2011 $ECEMBERææ
In millions of dollars Increase Decrease )NCREASE $ECREASE
U.S. dollar (1) ææ
)NSTANTANEOUSæCHANGE $97 NM .-
'RADUALæCHANGE 110 NM .-
Mexican peso ææ
)NSTANTANEOUSæCHANGE $ 87 $(87)
'RADUALæCHANGE 54 (54)
Euro ææ
)NSTANTANEOUSæCHANGE $69 NM .-
'RADUALæCHANGE 35 NM .-
Japanese yen ææ
)NSTANTANEOUSæCHANGE $105 NM .-
'RADUALæCHANGE 61 NM .-
Pound sterling ææ
)NSTANTANEOUSæCHANGE $35 NM .-
'RADUALæCHANGE 24 NM .-
ææ #ERTAINæTRADINGORIENTEDæBUSINESSESæWITHINæ#ITIæHAVEæACCRUALACCOUNTEDæPOSITIONSæTHATæAREæEXCLUDEDæ
FROMæTHEæTABLEæ4HEæ53æDOLLARæ)2%æASSOCIATEDæWITHæTHESEæBUSINESSESæWASææMILLIONæFORæAææBASISæ
POINTæINSTANTANEOUSæINCREASEæINæINTERESTæRATESæASæOFæ$ECEMBERææ
.-æ .OTæMEANINGFULæ!ææBASISæPOINTæDECREASEæINæINTERESTæRATESæWOULDæIMPLYæNEGATIVEæRATESæFORæTHEæ
YIELDæCURVE
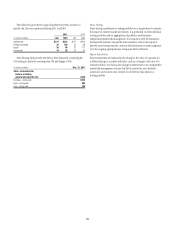
The changes in the U.S. dollar IRE year over year reflected revised
modeling of mortgages and the impact of lower rates, asset sales, swapping
activities and repositioning of the liquidity portfolio.
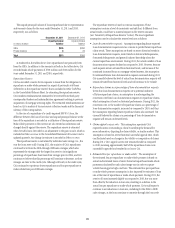
The following table shows the risk to NIR from six different changes in the
implied-forward rates. Each scenario assumes that the rate change will occur
on a gradual basis every three months over the course of one year.
3CENARIOæ 3CENARIOæ 3CENARIOæ 3CENARIOæ 3CENARIOæ 3CENARIOæ
/VERNIGHTæRATEæCHANGEæBPS
YEARæRATEæCHANGEæBPS
Impact to net interest revenue (in millions of dollars) æ.- .- æ