Citibank 2011 Annual Report Download - page 208
Download and view the complete annual report
Please find page 208 of the 2011 Citibank annual report below. You can navigate through the pages in the report by either clicking on the pages listed below, or by using the keyword search tool below to find specific information within the annual report.-
 1
1 -
2
-
3
-
4
-
5
-
6
-
7
-
8
-
9
-
10
-
11
-
12
-
13
-
14
-
15
-
16
-
17
-
18
-
19
-
20
-
21
-
22
-
23
-
24
-
25
-
26
-
27
-
28
-
29
-
30
-
31
-
32
-
33
-
34
-
35
-
36
-
37
-
38
-
39
-
40
-
41
-
42
-
43
-
44
-
45
-
46
-
47
-
48
-
49
-
50
-
51
-
52
-
53
-
54
-
55
-
56
-
57
-
58
-
59
-
60
-
61
-
62
-
63
-
64
-
65
-
66
-
67
-
68
-
69
-
70
-
71
-
72
-
73
-
74
-
75
-
76
-
77
-
78
-
79
-
80
-
81
-
82
-
83
-
84
-
85
-
86
-
87
-
88
-
89
-
90
-
91
-
92
-
93
-
94
-
95
-
96
-
97
-
98
-
99
-
100
-
101
-
102
-
103
-
104
-
105
-
106
-
107
-
108
-
109
-
110
-
111
-
112
-
113
-
114
-
115
-
116
-
117
-
118
-
119
-
120
-
121
-
122
-
123
-
124
-
125
-
126
-
127
-
128
-
129
-
130
-
131
-
132
-
133
-
134
-
135
-
136
-
137
-
138
-
139
-
140
-
141
-
142
-
143
-
144
-
145
-
146
-
147
-
148
-
149
-
150
-
151
-
152
-
153
-
154
-
155
-
156
-
157
-
158
-
159
-
160
-
161
-
162
-
163
-
164
-
165
-
166
-
167
-
168
-
169
-
170
-
171
-
172
-
173
-
174
-
175
-
176
-
177
-
178
-
179
-
180
-
181
-
182
-
183
-
184
-
185
-
186
-
187
-
188
-
189
-
190
-
191
-
192
-
193
-
194
-
195
-
196
-
197
-
 198
198 -
 199
199 -
 200
200 -
 201
201 -
 202
202 -
 203
203 -
 204
204 -
 205
205 -
 206
206 -
 207
207 -
 208
208 -
 209
209 -
 210
210 -
 211
211 -
 212
212 -
 213
213 -
 214
214 -
 215
215 -
 216
216 -
 217
217 -
 218
218 -
219
-
220
-
221
-
222
-
223
-
224
-
225
-
226
-
227
-
228
-
229
-
230
-
231
-
232
-
233
-
234
-
235
-
236
-
237
-
238
-
239
-
240
-
241
-
242
-
243
-
244
-
245
-
246
-
247
-
248
-
249
-
250
-
251
-
252
-
253
-
254
-
255
-
256
-
257
-
258
-
259
-
260
-
261
-
262
-
263
-
264
-
265
-
266
-
267
-
268
-
269
-
270
-
271
-
272
-
273
-
274
-
275
-
276
-
277
-
278
-
279
-
280
-
281
-
282
-
283
-
284
-
285
-
286
-
287
-
288
-
289
-
290
-
291
-
292
-
293
-
294
-
295
-
296
-
297
-
298
-
299
-
300
-
301
-
302
-
303
-
304
-
305
-
306
-
307
-
308
-
309
-
310
-
311
-
312
-
313
-
314
-
315
-
316
-
317
-
318
-
319
-
320
 |
 |

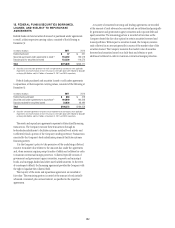
186
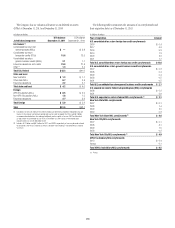
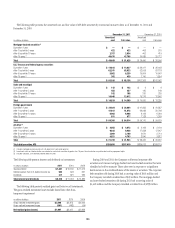
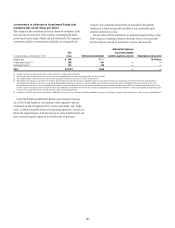
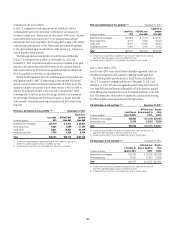
The following table presents the amortized cost and fair value of AFS debt securities by contractual maturity dates as of December 31, 2011 and
December 31, 2010:
December 31, 2011 $ECEMBERææ
In millions of dollars
Amortized
cost Fair value
!MORTIZEDæ
COST &AIRæVALUE
Mortgage-backed securities (1)
$UEæWITHINææYEAR $— $—
!FTERææBUTæWITHINææYEARS 422 423
!FTERææBUTæWITHINææYEARS 2,757 2,834
!FTERææYEARSæ 46,470 47,768
Total $ 49,649 $ 51,025
U.S. Treasury and federal agency securities
$UEæWITHINææYEAR $ 14,615 $ 14,637
!FTERææBUTæWITHINææYEARS 62,241 63,823
!FTERææBUTæWITHINææYEARS 5,862 6,239
!FTERææYEARSæ 382 439
Total $ 83,100 $ 85,138
State and municipal
$UEæWITHINææYEAR $ 142 $ 142
!FTERææBUTæWITHINææYEARS 455 457
!FTERææBUTæWITHINææYEARS 182 188
!FTERææYEARSæ 16,040 13,612
Total $ 16,819 $ 14,399
Foreign government
$UEæWITHINææYEAR $ 34,924 $ 34,864
!FTERææBUTæWITHINææYEARS 41,612 41,675
!FTERææBUTæWITHINææYEARS 6,993 6,998
!FTERææYEARSæ 831 977
Total $ 84,360 $ 84,514
All other (3)
$UEæWITHINææYEAR $ 4,055 $ 4,072
!FTERææBUTæWITHINææYEARS 9,843 9,928
!FTERææBUTæWITHINææYEARS 3,009 3,160
!FTERææYEARSæ 4,821 4,783
Total $ 21,728 $ 21,943
Total debt securities AFS $255,656 $257,019
æ )NCLUDESæMORTGAGEBACKEDæSECURITIESæOFæ53æGOVERNMENTSPONSOREDæAGENCIES
æ )NVESTMENTSæWITHæNOæSTATEDæMATURITIESæAREæINCLUDEDæASæCONTRACTUALæMATURITIESæOFæGREATERæTHANææYEARSæ!CTUALæMATURITIESæMAYæDIFFERæDUEæTOæCALLæORæPREPAYMENTæRIGHTS
æ )NCLUDESæCORPORATEæASSETBACKEDæANDæOTHERæDEBTæSECURITIES
The following table presents interest and dividends on investments:
In millions of dollars 2011
4AXABLEæINTEREST $ 7,441
)NTERESTæEXEMPTæFROMæ53æFEDERALæINCOMEæTAX 562
$IVIDENDS 317
Total interest and dividends $ 8,320
The following table presents realized gains and losses on all investments.
The gross realized investment losses exclude losses from other-than-
temporary impairment:
In millions of dollars 2011
'ROSSæREALIZEDæINVESTMENTæGAINS $ 2,498
'ROSSæREALIZEDæINVESTMENTæLOSSES (501)
Net realized gains (losses) $ 1,997
During 2010 and 2011, the Company sold several corporate debt
securities and various mortgage-backed and asset-backed securities that were
classified as held-to-maturity. These sales were in response to a significant
deterioration in the creditworthiness of the issuers or securities. The corporate
debt securities sold during 2010 had a carrying value of $413 million and
the Company recorded a realized loss of $49 million. The mortgage-backed
and asset-backed securities sold during 2011 had a carrying value of
$1,612 million and the Company recorded a realized loss of $299 million.