Citibank 2011 Annual Report Download - page 246
Download and view the complete annual report
Please find page 246 of the 2011 Citibank annual report below. You can navigate through the pages in the report by either clicking on the pages listed below, or by using the keyword search tool below to find specific information within the annual report.-
 1
1 -
2
-
3
-
4
-
5
-
6
-
7
-
8
-
9
-
10
-
11
-
12
-
13
-
14
-
15
-
16
-
17
-
18
-
19
-
20
-
21
-
22
-
23
-
24
-
25
-
26
-
27
-
28
-
29
-
30
-
31
-
32
-
33
-
34
-
35
-
36
-
37
-
38
-
39
-
40
-
41
-
42
-
43
-
44
-
45
-
46
-
47
-
48
-
49
-
50
-
51
-
52
-
53
-
54
-
55
-
56
-
57
-
58
-
59
-
60
-
61
-
62
-
63
-
64
-
65
-
66
-
67
-
68
-
69
-
70
-
71
-
72
-
73
-
74
-
75
-
76
-
77
-
78
-
79
-
80
-
81
-
82
-
83
-
84
-
85
-
86
-
87
-
88
-
89
-
90
-
91
-
92
-
93
-
94
-
95
-
96
-
97
-
98
-
99
-
100
-
101
-
102
-
103
-
104
-
105
-
106
-
107
-
108
-
109
-
110
-
111
-
112
-
113
-
114
-
115
-
116
-
117
-
118
-
119
-
120
-
121
-
122
-
123
-
124
-
125
-
126
-
127
-
128
-
129
-
130
-
131
-
132
-
133
-
134
-
135
-
136
-
137
-
138
-
139
-
140
-
141
-
142
-
143
-
144
-
145
-
146
-
147
-
148
-
149
-
150
-
151
-
152
-
153
-
154
-
155
-
156
-
157
-
158
-
159
-
160
-
161
-
162
-
163
-
164
-
165
-
166
-
167
-
168
-
169
-
170
-
171
-
172
-
173
-
174
-
175
-
176
-
177
-
178
-
179
-
180
-
181
-
182
-
183
-
184
-
185
-
186
-
187
-
188
-
189
-
190
-
191
-
192
-
193
-
194
-
195
-
196
-
197
-
198
-
199
-
200
-
201
-
202
-
203
-
204
-
205
-
206
-
207
-
208
-
209
-
210
-
211
-
212
-
213
-
214
-
215
-
216
-
217
-
218
-
219
-
220
-
221
-
222
-
223
-
224
-
225
-
226
-
227
-
228
-
229
-
230
-
231
-
232
-
233
-
234
-
235
-
 236
236 -
 237
237 -
 238
238 -
 239
239 -
 240
240 -
 241
241 -
 242
242 -
 243
243 -
 244
244 -
 245
245 -
 246
246 -
 247
247 -
 248
248 -
 249
249 -
 250
250 -
 251
251 -
 252
252 -
 253
253 -
 254
254 -
 255
255 -
 256
256 -
257
-
258
-
259
-
260
-
261
-
262
-
263
-
264
-
265
-
266
-
267
-
268
-
269
-
270
-
271
-
272
-
273
-
274
-
275
-
276
-
277
-
278
-
279
-
280
-
281
-
282
-
283
-
284
-
285
-
286
-
287
-
288
-
289
-
290
-
291
-
292
-
293
-
294
-
295
-
296
-
297
-
298
-
299
-
300
-
301
-
302
-
303
-
304
-
305
-
306
-
307
-
308
-
309
-
310
-
311
-
312
-
313
-
314
-
315
-
316
-
317
-
318
-
319
-
320
 |
 |

224
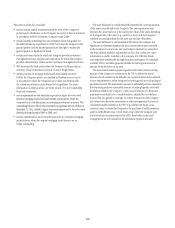
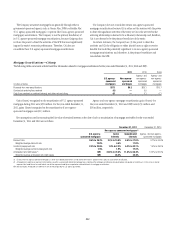
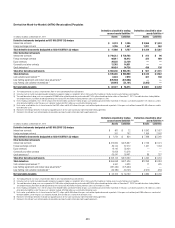
The effect of adverse changes of 10% and 20% in each of the key
assumptions used to determine the fair value of retained interests
is disclosed below. The negative effect of each change is calculated
independently, holding all other assumptions constant. Because the key
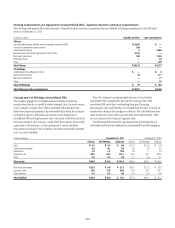
Mortgage Servicing Rights
In connection with the securitization of mortgage loans, the Company’s
U.S. Consumer mortgage business retains the servicing rights, which entitle
the Company to a future stream of cash flows based on the outstanding
principal balances of the loans and the contractual servicing fee. Failure to
service the loans in accordance with contractual requirements may lead to a
termination of the servicing rights and the loss of future servicing fees.
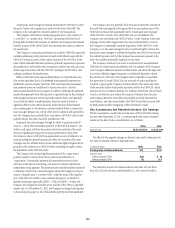
The fair value of capitalized mortgage servicing rights (MSRs) was
$2.6 billion and $4.6 billion at December 31, 2011 and 2010, respectively.
The MSRs correspond to principal loan balances of $401 billion and
$455 billion as of December 31, 2011 and 2010, respectively. The following
table summarizes the changes in capitalized MSRs for the years ended
December 31, 2011 and 2010:
In millions of dollars 2011
Balance, beginning of year $ 4,554
/RIGINATIONS 611
#HANGESæINæFAIRæVALUEæOFæ-32SæDUEæTOæCHANGESæINææ
INPUTSæANDæASSUMPTIONS (1,210)
/THERæCHANGESæ (1,174)
3ALEæOFæ-32S (212)
Balance, end of year $ 2,569 æ
æ 2EPRESENTSæCHANGESæDUEæTOæCUSTOMERæPAYMENTSæANDæPASSAGEæOFæTIME
assumptions may not in fact be independent, the net effect of simultaneous
adverse changes in the key assumptions may be less than the sum of the
individual effects shown below.
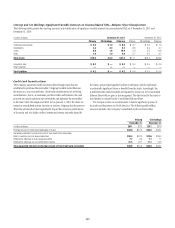
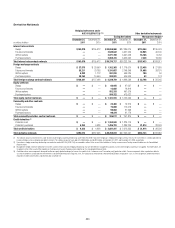
At December 31, 2011, the key assumptions used to value retained interests and the sensitivity of the fair value to adverse changes of 10% and 20% in each of
the key assumptions were as follows:
æDecember 31, 2011
Non-agency-sponsored mortgages (1)
U.S. agency-
sponsored mortgages
Senior
interests
Subordinated
interests
$ISCOUNTæRATE 6.9% 2.9% to 18.0% 6.7% to 18.2%
7EIGHTEDæAVERAGEæDISCOUNTæRATE 6.9% 9.8% 9.2%
#ONSTANTæPREPAYMENTæRATE 30.0% 38.8% 2.0% to 9.6%
7EIGHTEDæAVERAGEæCONSTANTæPREPAYMENTæRATE 30.0% 38.8% 8.1%
!NTICIPATEDæNETæCREDITæLOSSES NM 0.4 % 57.2% to 90.0%
7EIGHTEDæAVERAGEæANTICIPATEDæNETæCREDITæLOSSES NM 0.4% 63.2%
7EIGHTEDæAVERAGEæLIFE 3.7 years 3.3-4.7 years 0.0-8.1 years
ææ $ISCLOSUREæOFæNONAGENCYSPONSOREDæMORTGAGESæASæSENIORæANDæSUBORDINATEDæINTERESTSæISæINDICATIVEæOFæTHEæINTERESTSæPOSITIONæINæTHEæCAPITALæSTRUCTUREæOFæTHEæSECURITIZATION
.-æ .OTæMEANINGFULæ!NTICIPATEDæNETæCREDITæLOSSESæAREæNOTæMEANINGFULæDUEæTOæ53æAGENCYæGUARANTEES
In millions of dollars
U.S. agency-sponsored
mortgages
Non-agency-sponsored mortgages (1)
Senior interests Subordinated interests
Carrying value of retained interests $ 1,074 $ 170 $27
$ISCOUNTæRATES
!DVERSEæCHANGEæOFæ $ (29) $ (2) $ (3)
!DVERSEæCHANGEæOFæ (56) (3) (4)
#ONSTANTæPREPAYMENTæRATE
!DVERSEæCHANGEæOFæ $ (94) $ (25) $ (1)
!DVERSEæCHANGEæOFæ (180) (51) (1)
!NTICIPATEDæNETæCREDITæLOSSES
!DVERSEæCHANGEæOFæ $ (20) $ (9) $ (4)
!DVERSEæCHANGEæOFæ (40) (16) (6)
æ $ISCLOSUREæOFæNONAGENCYSPONSOREDæMORTGAGESæASæSENIORæANDæSUBORDINATEDæINTERESTSæISæINDICATIVEæOFæTHEæINTERESTSæPOSITIONæINæTHEæCAPITALæSTRUCTUREæOFæTHEæSECURITIZATION