Citibank 2011 Annual Report Download - page 179
Download and view the complete annual report
Please find page 179 of the 2011 Citibank annual report below. You can navigate through the pages in the report by either clicking on the pages listed below, or by using the keyword search tool below to find specific information within the annual report.-
 1
1 -
2
-
3
-
4
-
5
-
6
-
7
-
8
-
9
-
10
-
11
-
12
-
13
-
14
-
15
-
16
-
17
-
18
-
19
-
20
-
21
-
22
-
23
-
24
-
25
-
26
-
27
-
28
-
29
-
30
-
31
-
32
-
33
-
34
-
35
-
36
-
37
-
38
-
39
-
40
-
41
-
42
-
43
-
44
-
45
-
46
-
47
-
48
-
49
-
50
-
51
-
52
-
53
-
54
-
55
-
56
-
57
-
58
-
59
-
60
-
61
-
62
-
63
-
64
-
65
-
66
-
67
-
68
-
69
-
70
-
71
-
72
-
73
-
74
-
75
-
76
-
77
-
78
-
79
-
80
-
81
-
82
-
83
-
84
-
85
-
86
-
87
-
88
-
89
-
90
-
91
-
92
-
93
-
94
-
95
-
96
-
97
-
98
-
99
-
100
-
101
-
102
-
103
-
104
-
105
-
106
-
107
-
108
-
109
-
110
-
111
-
112
-
113
-
114
-
115
-
116
-
117
-
118
-
119
-
120
-
121
-
122
-
123
-
124
-
125
-
126
-
127
-
128
-
129
-
130
-
131
-
132
-
133
-
134
-
135
-
136
-
137
-
138
-
139
-
140
-
141
-
142
-
143
-
144
-
145
-
146
-
147
-
148
-
149
-
150
-
151
-
152
-
153
-
154
-
155
-
156
-
157
-
158
-
159
-
160
-
161
-
162
-
163
-
164
-
165
-
166
-
167
-
168
-
 169
169 -
 170
170 -
 171
171 -
 172
172 -
 173
173 -
 174
174 -
 175
175 -
 176
176 -
 177
177 -
 178
178 -
 179
179 -
 180
180 -
 181
181 -
 182
182 -
 183
183 -
 184
184 -
 185
185 -
 186
186 -
 187
187 -
 188
188 -
 189
189 -
190
-
191
-
192
-
193
-
194
-
195
-
196
-
197
-
198
-
199
-
200
-
201
-
202
-
203
-
204
-
205
-
206
-
207
-
208
-
209
-
210
-
211
-
212
-
213
-
214
-
215
-
216
-
217
-
218
-
219
-
220
-
221
-
222
-
223
-
224
-
225
-
226
-
227
-
228
-
229
-
230
-
231
-
232
-
233
-
234
-
235
-
236
-
237
-
238
-
239
-
240
-
241
-
242
-
243
-
244
-
245
-
246
-
247
-
248
-
249
-
250
-
251
-
252
-
253
-
254
-
255
-
256
-
257
-
258
-
259
-
260
-
261
-
262
-
263
-
264
-
265
-
266
-
267
-
268
-
269
-
270
-
271
-
272
-
273
-
274
-
275
-
276
-
277
-
278
-
279
-
280
-
281
-
282
-
283
-
284
-
285
-
286
-
287
-
288
-
289
-
290
-
291
-
292
-
293
-
294
-
295
-
296
-
297
-
298
-
299
-
300
-
301
-
302
-
303
-
304
-
305
-
306
-
307
-
308
-
309
-
310
-
311
-
312
-
313
-
314
-
315
-
316
-
317
-
318
-
319
-
320
 |
 |

157
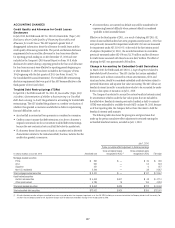
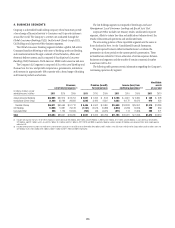
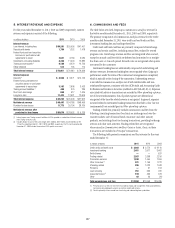
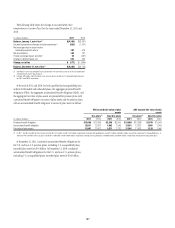
5. INTEREST REVENUE AND EXPENSE
For the years ended December 31, 2011, 2010 and 2009, respectively, interest
revenue and expense consisted of the following:
In millions of dollars 2011
Interest revenue
,OANæINTERESTæINCLUDINGæFEES $ 50,281
$EPOSITSæWITHæBANKS 1,750
&EDERALæFUNDSæSOLDæANDæSECURITIESææ
BORROWEDæORæPURCHASEDæUNDERææ
AGREEMENTSæTOæRESELL 3,631
)NVESTMENTSæINCLUDINGæDIVIDENDS 8,320
4RADINGæACCOUNTæASSETSæ 8,186
/THERæINTEREST 513
Total interest revenue $ 72,681
Interest expense
$EPOSITSæ $ 8,556
&EDERALæFUNDSæPURCHASEDæANDæ
SECURITIESæLOANEDæORæSOLDæUNDERæ
AGREEMENTSæTOæREPURCHASE 3,197
4RADINGæACCOUNTæLIABILITIESæ 408
3HORTTERMæBORROWINGS 650
,ONGTERMæDEBT 11,423
Total interest expense $ 24,234
Net interest revenue $48,447
0ROVISIONæFORæLOANæLOSSESæ 11,773
Net interest revenue after
provision for loan losses $ 36,674
æ )NTERESTæEXPENSEæONæTrading account liabilitiesæOFæICGæISæREPORTEDæASæAæREDUCTIONæOFæINTERESTæREVENUEæ
FROMæTrading account assets
æ )NCLUDESæDEPOSITæINSURANCEæFEESæANDæCHARGESæOFææBILLIONææMILLIONæANDææBILLIONæFORæTHEæ
æMONTHSæENDEDæ$ECEMBERææææANDææRESPECTIVELYæ4HEæMONTHæPERIODæENDEDæ
$ECEMBERæææINCLUDESæTHEæONETIMEæ&$)#æSPECIALæASSESSMENT
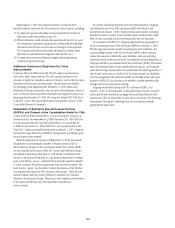
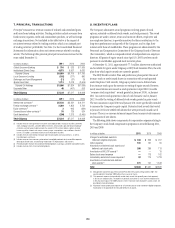
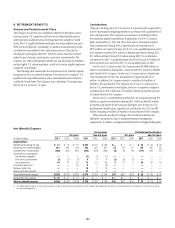
6. COMMISSIONS AND FEES
The table below sets forth Citigroup’s Commissions and fees revenue for
the twelve months ended December 31, 2011, 2010 and 2009, respectively.
The primary components of Commissions and fees revenue for the twelve
months ended December 31, 2011 were credit card and bank card fees,
investment banking fees and trading-related fees.
Credit card and bank card fees are primarily composed of interchange
revenue and certain card fees, including annual fees, reduced by reward
program costs. Interchange revenue and fees are recognized when earned,
except for annual card fees which are deferred and amortized on a straight-
line basis over a 12-month period. Reward costs are recognized when points
are earned by the customers.
Investment banking fees are substantially composed of underwriting and
advisory revenues. Investment banking fees are recognized when Citigroup’s
performance under the terms of the contractual arrangements is completed,
which is typically at the closing of the transaction. Underwriting revenue
is recorded in Commissions and fees net of both reimbursable and non-
reimbursable expenses, consistent with the AICPA Audit and Accounting Guide
for Brokers and Dealers in Securities (codified in ASC 940-605-05-1). Expenses
associated with advisory transactions are recorded in Other operating expenses,
net of client reimbursements. Out-of-pocket expenses are deferred and
recognized at the time the related revenue is recognized. In general, expenses
incurred related to investment banking transactions that fail to close (are not
consummated) are recorded gross in Other operating expenses.
Trading-related fees primarily include commissions and fees from the
following: executing transactions for clients on exchanges and over-the-
counter markets; sale of mutual funds, insurance and other annuity
products; and assisting clients in clearing transactions, providing brokerage
services and other such activities. Trading-related fees are recognized
when earned in Commissions and fees. Gains or losses, if any, on these
transactions are included in Principal transactions.
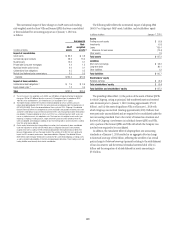
The following table presents commissions and fees revenue for the years
ended December 31:
In millions of dollars 2011
#REDITæCARDSæANDæBANKæCARDS $ 3,603
)NVESTMENTæBANKING 2,451
3MITHæ"ARNEY —
4RADINGRELATED 2,587
4RANSACTIONæSERVICES 1,520
/THERæ#ONSUMERæ 931
#HECKINGRELATED 926
0RIMERICA —
,OANæSERVICING 251
#ORPORATEæFINANCEæ 519
/THER 62
Total commissions and fees $12,850
æ 0RIMARILYæCONSISTSæOFæFEESæFORæINVESTMENTæFUNDæADMINISTRATIONæANDæMANAGEMENTæTHIRDPARTYæCOLLECTIONSæ
COMMERCIALæDEMANDæDEPOSITæACCOUNTSæANDæCERTAINæCREDITæCARDæSERVICES
æ #ONSISTSæPRIMARILYæOFæFEESæEARNEDæFROMæSTRUCTURINGæANDæUNDERWRITINGæLOANæSYNDICATIONS