Citibank 2011 Annual Report Download - page 32
Download and view the complete annual report
Please find page 32 of the 2011 Citibank annual report below. You can navigate through the pages in the report by either clicking on the pages listed below, or by using the keyword search tool below to find specific information within the annual report.-
 1
1 -
2
-
3
-
4
-
5
-
6
-
7
-
8
-
9
-
10
-
11
-
12
-
13
-
14
-
15
-
16
-
17
-
18
-
19
-
20
-
21
-
 22
22 -
 23
23 -
 24
24 -
 25
25 -
 26
26 -
 27
27 -
 28
28 -
 29
29 -
 30
30 -
 31
31 -
 32
32 -
 33
33 -
 34
34 -
 35
35 -
 36
36 -
 37
37 -
 38
38 -
 39
39 -
 40
40 -
 41
41 -
 42
42 -
43
-
44
-
45
-
46
-
47
-
48
-
49
-
50
-
51
-
52
-
53
-
54
-
55
-
56
-
57
-
58
-
59
-
60
-
61
-
62
-
63
-
64
-
65
-
66
-
67
-
68
-
69
-
70
-
71
-
72
-
73
-
74
-
75
-
76
-
77
-
78
-
79
-
80
-
81
-
82
-
83
-
84
-
85
-
86
-
87
-
88
-
89
-
90
-
91
-
92
-
93
-
94
-
95
-
96
-
97
-
98
-
99
-
100
-
101
-
102
-
103
-
104
-
105
-
106
-
107
-
108
-
109
-
110
-
111
-
112
-
113
-
114
-
115
-
116
-
117
-
118
-
119
-
120
-
121
-
122
-
123
-
124
-
125
-
126
-
127
-
128
-
129
-
130
-
131
-
132
-
133
-
134
-
135
-
136
-
137
-
138
-
139
-
140
-
141
-
142
-
143
-
144
-
145
-
146
-
147
-
148
-
149
-
150
-
151
-
152
-
153
-
154
-
155
-
156
-
157
-
158
-
159
-
160
-
161
-
162
-
163
-
164
-
165
-
166
-
167
-
168
-
169
-
170
-
171
-
172
-
173
-
174
-
175
-
176
-
177
-
178
-
179
-
180
-
181
-
182
-
183
-
184
-
185
-
186
-
187
-
188
-
189
-
190
-
191
-
192
-
193
-
194
-
195
-
196
-
197
-
198
-
199
-
200
-
201
-
202
-
203
-
204
-
205
-
206
-
207
-
208
-
209
-
210
-
211
-
212
-
213
-
214
-
215
-
216
-
217
-
218
-
219
-
220
-
221
-
222
-
223
-
224
-
225
-
226
-
227
-
228
-
229
-
230
-
231
-
232
-
233
-
234
-
235
-
236
-
237
-
238
-
239
-
240
-
241
-
242
-
243
-
244
-
245
-
246
-
247
-
248
-
249
-
250
-
251
-
252
-
253
-
254
-
255
-
256
-
257
-
258
-
259
-
260
-
261
-
262
-
263
-
264
-
265
-
266
-
267
-
268
-
269
-
270
-
271
-
272
-
273
-
274
-
275
-
276
-
277
-
278
-
279
-
280
-
281
-
282
-
283
-
284
-
285
-
286
-
287
-
288
-
289
-
290
-
291
-
292
-
293
-
294
-
295
-
296
-
297
-
298
-
299
-
300
-
301
-
302
-
303
-
304
-
305
-
306
-
307
-
308
-
309
-
310
-
311
-
312
-
313
-
314
-
315
-
316
-
317
-
318
-
319
-
320
 |
 |

10
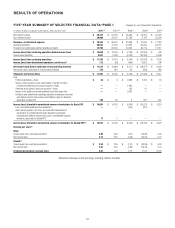
RESULTS OF OPERATIONS
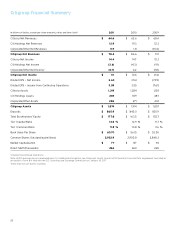
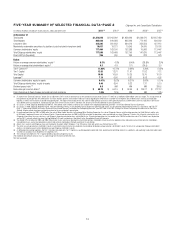
FIVE-YEAR SUMMARY OF SELECTED FINANCIAL DATA—PAGE 1 Citigroup Inc. and Consolidated Subsidiaries
In millions of dollars, except per-share amounts, ratios and direct staff 2011 (1) æ æ æ æ
.ETæINTERESTæREVENUE $ 48,447
.ONINTERESTæREVENUE 29,906
Revenues, net of interest expense $ 78,353
/PERATINGæEXPENSES 50,933
0ROVISIONSæFORæCREDITæLOSSESæANDæFORæBENEFITSæANDæCLAIMS 12,796
Income (loss) from continuing operations before income taxes $ 14,624
)NCOMEæTAXESæBENEFITS 3,521
Income (loss) from continuing operations $ 11,103
Income (loss) from discontinued operations, net of taxes (4) 112
Net income (loss) before attribution of noncontrolling interests $ 11,215
.ETæINCOMEæLOSSæATTRIBUTABLEæTOæNONCONTROLLINGæINTERESTS 148
Citigroup’s net income (loss) $ 11,067
,ESS
0REFERREDæDIVIDENDS"ASIC $ 26
)MPACTæOFæTHEæCONVERSIONæPRICEæRESETæRELATEDæTOæTHEææBILLIONææ
CONVERTIBLEæPREFERREDæSTOCKæPRIVATEæISSUANCE"ASIC —
0REFERREDæSTOCKæ3ERIESæ(æDISCOUNTæACCRETION"ASIC —
)MPACTæOFæTHEæPUBLICæANDæPRIVATEæPREFERREDæSTOCKæEXCHANGEæOFFER —
$IVIDENDSæANDæUNDISTRIBUTEDæEARNINGSæALLOCATEDæTOæEMPLOYEEæRESTRICTEDææ
ANDæDEFERREDæSHARESæTHATæCONTAINæNONFORFEITABLEæRIGHTSæTOæDIVIDENDSææ
APPLICABLEæTOæ"ASICæ%03 186
Income (loss) allocated to unrestricted common shareholders for Basic EPS $ 10,855
,ESSæ#ONVERTIBLEæPREFERREDæSTOCKæDIVIDENDSæ —
!DDæ)NTERESTæEXPENSEæNETæOFæTAXæONæCONVERTIBLEæSECURITIESæANDææ
ADJUSTMENTæOFæUNDISTRIBUTEDæEARNINGSæALLOCATEDæTOæEMPLOYEEææ
RESTRICTEDæANDæDEFERREDæSHARESæTHATæCONTAINæNONFORFEITABLEæRIGHTSæTOææ
DIVIDENDSæAPPLICABLEæTOæDILUTEDæ%03 17
Income (loss) allocated to unrestricted common shareholders for diluted EPS (5) $ 10,872
Earnings per share (6)
Basic
)NCOMEæLOSSæFROMæCONTINUINGæOPERATIONS 3.69 ææ æ æ æ
.ETæINCOMEæLOSS 3.73 ææ
Diluted (5)
)NCOMEæLOSSæFROMæCONTINUINGæOPERATIONS $ 3.59
.ETæINCOMEæLOSS 3.63
Dividends declared per common share 0.03 ææ
3TATEMENTæCONTINUESæONæTHEæNEXTæPAGEæINCLUDINGæNOTESæTOæTHEæTABLE