Citibank 2011 Annual Report Download - page 103
Download and view the complete annual report
Please find page 103 of the 2011 Citibank annual report below. You can navigate through the pages in the report by either clicking on the pages listed below, or by using the keyword search tool below to find specific information within the annual report.-
 1
1 -
2
-
3
-
4
-
5
-
6
-
7
-
8
-
9
-
10
-
11
-
12
-
13
-
14
-
15
-
16
-
17
-
18
-
19
-
20
-
21
-
22
-
23
-
24
-
25
-
26
-
27
-
28
-
29
-
30
-
31
-
32
-
33
-
34
-
35
-
36
-
37
-
38
-
39
-
40
-
41
-
42
-
43
-
44
-
45
-
46
-
47
-
48
-
49
-
50
-
51
-
52
-
53
-
54
-
55
-
56
-
57
-
58
-
59
-
60
-
61
-
62
-
63
-
64
-
65
-
66
-
67
-
68
-
69
-
70
-
71
-
72
-
73
-
74
-
75
-
76
-
77
-
78
-
79
-
80
-
81
-
82
-
83
-
84
-
85
-
86
-
87
-
88
-
89
-
90
-
91
-
92
-
 93
93 -
 94
94 -
 95
95 -
 96
96 -
 97
97 -
 98
98 -
 99
99 -
 100
100 -
 101
101 -
 102
102 -
 103
103 -
 104
104 -
 105
105 -
 106
106 -
 107
107 -
 108
108 -
 109
109 -
 110
110 -
 111
111 -
 112
112 -
 113
113 -
114
-
115
-
116
-
117
-
118
-
119
-
120
-
121
-
122
-
123
-
124
-
125
-
126
-
127
-
128
-
129
-
130
-
131
-
132
-
133
-
134
-
135
-
136
-
137
-
138
-
139
-
140
-
141
-
142
-
143
-
144
-
145
-
146
-
147
-
148
-
149
-
150
-
151
-
152
-
153
-
154
-
155
-
156
-
157
-
158
-
159
-
160
-
161
-
162
-
163
-
164
-
165
-
166
-
167
-
168
-
169
-
170
-
171
-
172
-
173
-
174
-
175
-
176
-
177
-
178
-
179
-
180
-
181
-
182
-
183
-
184
-
185
-
186
-
187
-
188
-
189
-
190
-
191
-
192
-
193
-
194
-
195
-
196
-
197
-
198
-
199
-
200
-
201
-
202
-
203
-
204
-
205
-
206
-
207
-
208
-
209
-
210
-
211
-
212
-
213
-
214
-
215
-
216
-
217
-
218
-
219
-
220
-
221
-
222
-
223
-
224
-
225
-
226
-
227
-
228
-
229
-
230
-
231
-
232
-
233
-
234
-
235
-
236
-
237
-
238
-
239
-
240
-
241
-
242
-
243
-
244
-
245
-
246
-
247
-
248
-
249
-
250
-
251
-
252
-
253
-
254
-
255
-
256
-
257
-
258
-
259
-
260
-
261
-
262
-
263
-
264
-
265
-
266
-
267
-
268
-
269
-
270
-
271
-
272
-
273
-
274
-
275
-
276
-
277
-
278
-
279
-
280
-
281
-
282
-
283
-
284
-
285
-
286
-
287
-
288
-
289
-
290
-
291
-
292
-
293
-
294
-
295
-
296
-
297
-
298
-
299
-
300
-
301
-
302
-
303
-
304
-
305
-
306
-
307
-
308
-
309
-
310
-
311
-
312
-
313
-
314
-
315
-
316
-
317
-
318
-
319
-
320
 |
 |
81
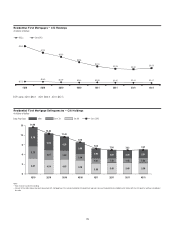
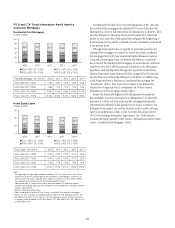
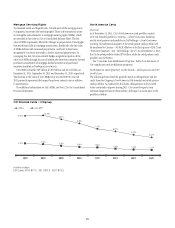
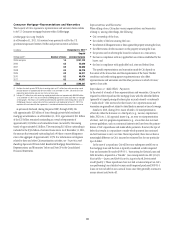
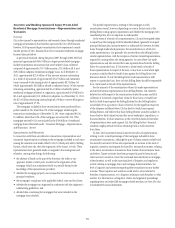
FICO and LTV Trend Information—
North America
Consumer Mortgages
0
20
40
60
80
100
4Q113Q112Q111Q114Q10
12.6 12.4 11.9 10.7 11.1
20.9 19.2 18.6 18.7 17.8
13.9 15.1 13.8 12.2 13.2
36.6 36.2 37.4 39.6 39.6
Residential First Mortgages
In billions of dollars
FICO < 660, LTV > 100% FICO < 660, LTV ≤ 100%
FICO ≥ 660, LTV > 100% FICO ≥ 660, LTV ≤ 100%
2ESIDENTIALæ-ORTGAGEæ$0$æ 1 1 1 1 1
&)#/æ≥ææ,46æ≤æ
&)#/æ≥ææ,46ææ
&)#/æææ,46æ≤æ
&)#/æææ,46ææ
0
20
40
60
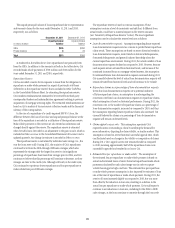
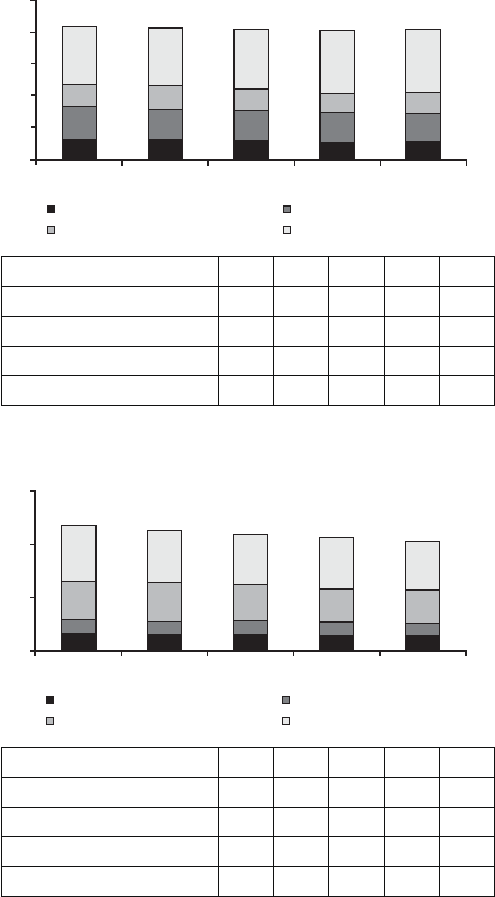
4Q113Q112Q111Q114Q10
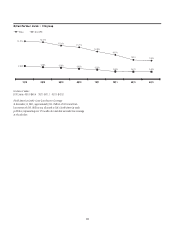
6.1 5.8 5.8 5.3 5.4
5.5 5.1 5.3 5.3 4.5
14.3 14.6 13.6 12.5 12.8
21.2 19.8 19.1 19.4 18.4
Home Equity Loans
In billions of dollars
FICO < 660, LTV > 100% FICO < 660, LTV ≤ 100%
FICO ≥ 660, LTV > 100% FICO ≥ 660, LTV ≤ 100%
(OMEæ%QUITYæ$0$æ 1 1 1 1 1
&)#/æ≥ææ,46æ≤æ
&)#/æ≥ææ,46ææ
&)#/æææ,46æ≤æ
&)#/æææ,46ææ
.OTESæ
nææ$ATAæAPPEARINGæINæTHEæTABLESæABOVEæHAVEæBEENæSOURCEDæFROMæ#ITISæRISKæSYSTEMSæANDæASæSUCHæMAYæNOTæ
RECONCILEæWITHæDISCLOSURESæELSEWHEREæGENERALLYæDUEæTOæDIFFERENCESæINæMETHODOLOGYæORæVARIATIONSæINæTHEæ
MANNERæINæWHICHæINFORMATIONæISæCAPTUREDæ#ITIæHASæNOTEDæSUCHæVARIATIONSæINæINSTANCESæWHEREæITæBELIEVESæ
THEYæCOULDæBEæMATERIALæTOæRECONCILEæTOæTHEæINFORMATIONæPRESENTEDæELSEWHERE
nææ4ABLESæEXCLUDEæLOANSæINæ#ANADAæANDæ0UERTOæ2ICOæLOANSæGUARANTEEDæBYæ53æGOVERNMENTæAGENCIESæ
RESIDENTIALæFIRSTæMORTGAGESæTABLEæONLYæLOANSæRECORDEDæATæFAIRæVALUEæRESIDENTIALæFIRSTæMORTGAGESæTABLEæONLYæ
ANDæLOANSæSUBJECTæTOæ,43#S
nææ"ALANCESæEXCLUDEæDEFERREDæFEESCOSTSæ
nææ4ABLESæEXCLUDEæBALANCESæFORæWHICHæ&)#/æORæ,46æDATAæISæUNAVAILABLEæ&ORæRESIDENTIALæFIRSTæMORTGAGESæ
BALANCESæFORæWHICHæSUCHæDATAæISæUNAVAILABLEæINCLUDESæææBILLIONæFORæ1ææBILLIONæFORæ1æANDæ
æBILLIONæINæEACHæOFæ1æ1æANDæ1æ&ORæHOMEæEQUITYæLOANSæBALANCESæFORæWHICHæSUCHæDATAæISæ
UNAVAILABLEæINCLUDESææBILLIONæINæ1ææBILLIONæINæ1ææBILLIONæINæ1ææBILLIONæINæ1æ
ANDææBILLIONæINæ1
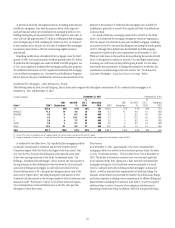
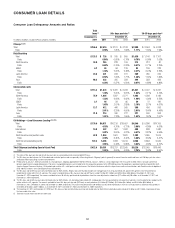
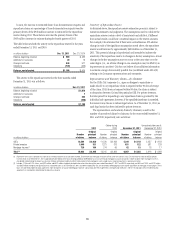
As evidenced by the table above, the overall proportion of 90+ days past
due residential first mortgages with refreshed FICO scores of less than 660
decreased year over year. Citi believes that the deterioration in these 90+ days
past due delinquency ratios from third to fourth quarter 2011 reflects the
decline in Citi’s asset sales of delinquent first mortgages, the lengthening of
the foreclosure process and the continued economic uncertainty, as discussed
in the sections above.
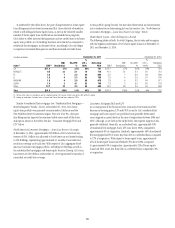
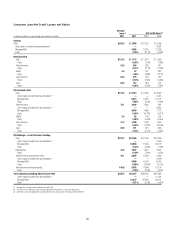
Although home equity loans are typically in junior lien positions and
residential first mortgages are typically in a first lien position, residential
first mortgages historically have experienced higher delinquency rates as
compared to home equity loans. Citi believes this difference is primarily
due to the fact that residential first mortgages are written down to collateral
value less cost to sell at 180 days past due and remain in the delinquency
population until full disposition through sale, repayment or foreclosure,
whereas home equity loans are generally fully charged off at 180 days past
due and thus removed from the delinquency calculation. In addition, due
to the longer timelines to foreclose on a residential first mortgage (see
“Foreclosures” above), these loans tend to remain in the delinquency
statistics for a longer period and, consequently, the 90 days or more
delinquencies of these mortgages remain higher.
Despite this historically higher level of delinquencies for residential
first mortgages, however, home equity loan delinquencies have generally
decreased at a slower rate than residential first mortgage delinquencies.
Citi believes this difference is due primarily to the lack of a market to sell
delinquent home equity loans and the relatively smaller number of home
equity loan modifications which, to date, have been the primary drivers
of Citi’s first mortgage delinquency improvement (see “North America
Consumer Mortgage Quarterly Credit Trends—Delinquencies and Net Credit
Losses—Residential First Mortgages” above).