Citibank 2011 Annual Report Download - page 201
Download and view the complete annual report
Please find page 201 of the 2011 Citibank annual report below. You can navigate through the pages in the report by either clicking on the pages listed below, or by using the keyword search tool below to find specific information within the annual report.-
 1
1 -
2
-
3
-
4
-
5
-
6
-
7
-
8
-
9
-
10
-
11
-
12
-
13
-
14
-
15
-
16
-
17
-
18
-
19
-
20
-
21
-
22
-
23
-
24
-
25
-
26
-
27
-
28
-
29
-
30
-
31
-
32
-
33
-
34
-
35
-
36
-
37
-
38
-
39
-
40
-
41
-
42
-
43
-
44
-
45
-
46
-
47
-
48
-
49
-
50
-
51
-
52
-
53
-
54
-
55
-
56
-
57
-
58
-
59
-
60
-
61
-
62
-
63
-
64
-
65
-
66
-
67
-
68
-
69
-
70
-
71
-
72
-
73
-
74
-
75
-
76
-
77
-
78
-
79
-
80
-
81
-
82
-
83
-
84
-
85
-
86
-
87
-
88
-
89
-
90
-
91
-
92
-
93
-
94
-
95
-
96
-
97
-
98
-
99
-
100
-
101
-
102
-
103
-
104
-
105
-
106
-
107
-
108
-
109
-
110
-
111
-
112
-
113
-
114
-
115
-
116
-
117
-
118
-
119
-
120
-
121
-
122
-
123
-
124
-
125
-
126
-
127
-
128
-
129
-
130
-
131
-
132
-
133
-
134
-
135
-
136
-
137
-
138
-
139
-
140
-
141
-
142
-
143
-
144
-
145
-
146
-
147
-
148
-
149
-
150
-
151
-
152
-
153
-
154
-
155
-
156
-
157
-
158
-
159
-
160
-
161
-
162
-
163
-
164
-
165
-
166
-
167
-
168
-
169
-
170
-
171
-
172
-
173
-
174
-
175
-
176
-
177
-
178
-
179
-
180
-
181
-
182
-
183
-
184
-
185
-
186
-
187
-
188
-
189
-
190
-
 191
191 -
 192
192 -
 193
193 -
 194
194 -
 195
195 -
 196
196 -
 197
197 -
 198
198 -
 199
199 -
 200
200 -
 201
201 -
 202
202 -
 203
203 -
 204
204 -
 205
205 -
 206
206 -
 207
207 -
 208
208 -
 209
209 -
 210
210 -
 211
211 -
212
-
213
-
214
-
215
-
216
-
217
-
218
-
219
-
220
-
221
-
222
-
223
-
224
-
225
-
226
-
227
-
228
-
229
-
230
-
231
-
232
-
233
-
234
-
235
-
236
-
237
-
238
-
239
-
240
-
241
-
242
-
243
-
244
-
245
-
246
-
247
-
248
-
249
-
250
-
251
-
252
-
253
-
254
-
255
-
256
-
257
-
258
-
259
-
260
-
261
-
262
-
263
-
264
-
265
-
266
-
267
-
268
-
269
-
270
-
271
-
272
-
273
-
274
-
275
-
276
-
277
-
278
-
279
-
280
-
281
-
282
-
283
-
284
-
285
-
286
-
287
-
288
-
289
-
290
-
291
-
292
-
293
-
294
-
295
-
296
-
297
-
298
-
299
-
300
-
301
-
302
-
303
-
304
-
305
-
306
-
307
-
308
-
309
-
310
-
311
-
312
-
313
-
314
-
315
-
316
-
317
-
318
-
319
-
320
 |
 |

179
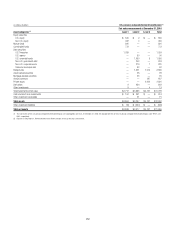
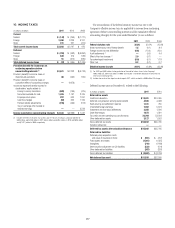
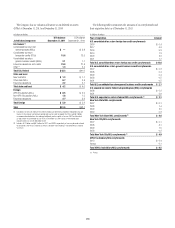
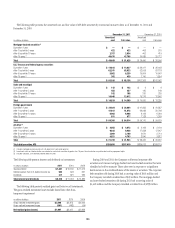
The Company has no valuation allowance on its deferred tax assets
(DTAs) at December 31, 2011 and December 31, 2010.
In billions of dollars
Jurisdiction/component
DTA balance
December 31, 2011
$4!æBALANCEæ
$ECEMBERææ
U.S. federal (1)
#ONSOLIDATEDæTAXæRETURNæNETææ
OPERATINGæLOSSESæ./,S $—
#ONSOLIDATEDæTAXæRETURNææ
FOREIGNæTAXæCREDITSæ&4#S 15.8
#ONSOLIDATEDæTAXæRETURNææ
GENERALæBUSINESSæCREDITSæ'"#S 2.1
&UTUREæTAXæDEDUCTIONSæANDæCREDITS 23.0
/THERæ 1.4
Total U.S. federal $42.3
State and local
.EWæ9ORKæ./,S $ 1.3 ææ
/THERæSTATEæ./,S 0.7
&UTUREæTAXæDEDUCTIONS 2.2
Total state and local $ 4.2
Foreign
!0"ææSUBSIDIARYæ./,S $ 0.5
.ON!0"ææSUBSIDIARYæ./,S 1.8
&UTUREæTAXæDEDUCTIONS 2.7
Total foreign $ 5.0 ææ
Total $51.5
æ )NCLUDEDæINæTHEæNETæ53æFEDERALæ$4!SæOFææBILLIONæAREæDEFERREDæTAXæLIABILITIESæOFææBILLIONæTHATæWILLæ
REVERSEæINæTHEæRELEVANTæCARRYFORWARDæPERIODæANDæMAYæBEæUSEDæTOæSUPPORTæTHEæ$4!SæANDææBILLIONæ
INæCOMPENSATIONæDEDUCTIONSæTHATæREDUCEDæADDITIONALæPAIDINæCAPITALæINæ*ANUARYææANDæFORæWHICHæ
NOæADJUSTMENTæWASæPERMITTEDæTOæSUCHæ$4!SæATæ$ECEMBERæææBECAUSEæTHEæRELATEDæSTOCKæ
COMPENSATIONæWASæNOTæYETæDEDUCTIBLEæTOæ#ITI
æ )NCLUDESææBILLIONæANDææBILLIONæFORææANDææRESPECTIVELYæOFæTAXæCARRYFORWARDSæRELATEDæ
TOæCOMPANIESæTHATæFILEæ53æFEDERALæTAXæRETURNSæSEPARATEæFROMæ#ITIGROUPSæCONSOLIDATEDæ53æFEDERALæ
TAXæRETURN
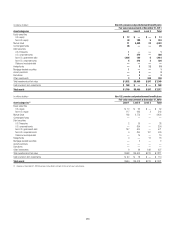
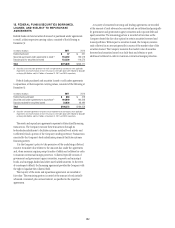
The following table summarizes the amounts of tax carryforwards and
their expiration dates as of December 31, 2011:
In billions of dollars
Year of expiration Amount
U.S. consolidated tax return foreign tax credit carryforwards
Total U.S. consolidated tax return foreign tax credit carryforwards $15.8
U.S. consolidated tax return general business credit carryforwards
Total U.S. consolidated tax return general business credit carryforwards $ 2.1
U.S. separate tax returns federal net operating loss (NOL) carryforwards
Total U.S. separate tax returns federal NOL carryforwards (1) $ 3.1
New York State NOL carryforwards
Total New York State NOL carryforwards (1) $ 9.8
New York City NOL carryforwards
Total New York City NOL carryforwards (1) $ 4.9
APB 23 subsidiary NOL carryforwards
6ARIOUS
Total APB 23 subsidiary NOL carryforwards $ 0.5
ææ 0RETAX