Citibank 2011 Annual Report Download - page 272
Download and view the complete annual report
Please find page 272 of the 2011 Citibank annual report below. You can navigate through the pages in the report by either clicking on the pages listed below, or by using the keyword search tool below to find specific information within the annual report.-
 1
1 -
2
-
3
-
4
-
5
-
6
-
7
-
8
-
9
-
10
-
11
-
12
-
13
-
14
-
15
-
16
-
17
-
18
-
19
-
20
-
21
-
22
-
23
-
24
-
25
-
26
-
27
-
28
-
29
-
30
-
31
-
32
-
33
-
34
-
35
-
36
-
37
-
38
-
39
-
40
-
41
-
42
-
43
-
44
-
45
-
46
-
47
-
48
-
49
-
50
-
51
-
52
-
53
-
54
-
55
-
56
-
57
-
58
-
59
-
60
-
61
-
62
-
63
-
64
-
65
-
66
-
67
-
68
-
69
-
70
-
71
-
72
-
73
-
74
-
75
-
76
-
77
-
78
-
79
-
80
-
81
-
82
-
83
-
84
-
85
-
86
-
87
-
88
-
89
-
90
-
91
-
92
-
93
-
94
-
95
-
96
-
97
-
98
-
99
-
100
-
101
-
102
-
103
-
104
-
105
-
106
-
107
-
108
-
109
-
110
-
111
-
112
-
113
-
114
-
115
-
116
-
117
-
118
-
119
-
120
-
121
-
122
-
123
-
124
-
125
-
126
-
127
-
128
-
129
-
130
-
131
-
132
-
133
-
134
-
135
-
136
-
137
-
138
-
139
-
140
-
141
-
142
-
143
-
144
-
145
-
146
-
147
-
148
-
149
-
150
-
151
-
152
-
153
-
154
-
155
-
156
-
157
-
158
-
159
-
160
-
161
-
162
-
163
-
164
-
165
-
166
-
167
-
168
-
169
-
170
-
171
-
172
-
173
-
174
-
175
-
176
-
177
-
178
-
179
-
180
-
181
-
182
-
183
-
184
-
185
-
186
-
187
-
188
-
189
-
190
-
191
-
192
-
193
-
194
-
195
-
196
-
197
-
198
-
199
-
200
-
201
-
202
-
203
-
204
-
205
-
206
-
207
-
208
-
209
-
210
-
211
-
212
-
213
-
214
-
215
-
216
-
217
-
218
-
219
-
220
-
221
-
222
-
223
-
224
-
225
-
226
-
227
-
228
-
229
-
230
-
231
-
232
-
233
-
234
-
235
-
236
-
237
-
238
-
239
-
240
-
241
-
242
-
243
-
244
-
245
-
246
-
247
-
248
-
249
-
250
-
251
-
252
-
253
-
254
-
255
-
256
-
257
-
258
-
259
-
260
-
261
-
 262
262 -
 263
263 -
 264
264 -
 265
265 -
 266
266 -
 267
267 -
 268
268 -
 269
269 -
 270
270 -
 271
271 -
 272
272 -
 273
273 -
 274
274 -
 275
275 -
 276
276 -
 277
277 -
 278
278 -
 279
279 -
 280
280 -
 281
281 -
 282
282 -
283
-
284
-
285
-
286
-
287
-
288
-
289
-
290
-
291
-
292
-
293
-
294
-
295
-
296
-
297
-
298
-
299
-
300
-
301
-
302
-
303
-
304
-
305
-
306
-
307
-
308
-
309
-
310
-
311
-
312
-
313
-
314
-
315
-
316
-
317
-
318
-
319
-
320
 |
 |

250
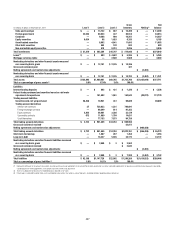
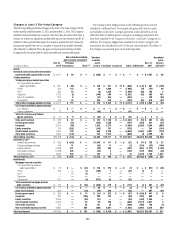
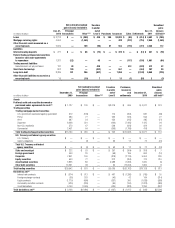
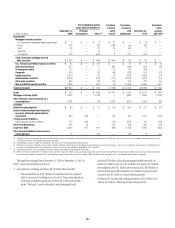
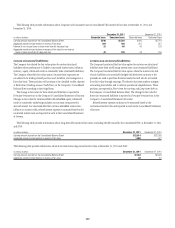
Changes in Level 3 Fair Value Category
The following tables present the changes in the Level 3 fair value category for the
twelve months ended December 31, 2011 and December 31, 2010. The Company
classifies financial instruments in Level 3 of the fair value hierarchy when there is
reliance on at least one significant unobservable input to the valuation model. In
addition to these unobservable inputs, the valuation models for Level 3 financial
instruments typically also rely on a number of inputs that are readily observable
either directly or indirectly. Thus, the gains and losses presented below include
changes in the fair value related to both observable and unobservable inputs.
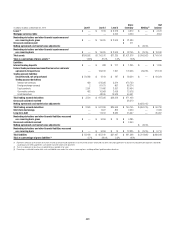
The Company often hedges positions with offsetting positions that are
classified in a different level. For example, the gains and losses for assets
and liabilities in the Level 3 category presented in the tables below do not
reflect the effect of offsetting losses and gains on hedging instruments that
have been classified by the Company in the Level 1 and Level 2 categories. In
addition, the Company hedges items classified in the Level 3 category with
instruments also classified in Level 3 of the fair value hierarchy. The effects of
these hedges are presented gross in the following tables.
Net realized/unrealized
gains (losses) included in
(1)(2)
Transfers
in and/or
out of
Level 3 Purchases Issuances Sales Settlements
Dec. 31,
2011
Unrealized
gains
(losses)
still held (3)
In millions of dollars
Dec. 31,
2010
Principal
transactions Other
Assets
Fed funds sold and securities borrowed or
purchased under agreements to resell $ 90 $ — $ (300) $ — $ — $ — $ — $ 4,701 $ 89
Trading securities
Trading mortgage-backed securities
53æGOVERNMENTSPONSOREDæ
AGENCYæGUARANTEED $ (62) $ — $ 169 $ 677 $ 73 $ (686) $ (141) $ 861 $ (100)
0RIME 125 — 59 1,608 — (1,608) (19) 759 48
!LT! 19 — (8) 1,638 — (1,849) (20) 165 2
3UBPRIME (2) — (148) 550 — (1,021) (39) 465 103
.ON53æRESIDENTIAL 6 — (41) 354 — (423) — 120 (35)
#OMMERCIAL 33 — 345 418 — (570) (26) 618 (57)
Total trading mortgage-backed securities $ 119 $ — $ 376 $ 5,245 $ 73 $ (6,157) $ (245) $ 2,988 $ (39)
U.S. Treasury and federal agency securities
53æ4REASURY $— $ — $— $ — $—$ — $ —$ — $ —
!GENCYæOBLIGATIONS 9 — (45) 8 — (41) — 3 —
Total U.S. Treasury and federal
agency securities $ 9 $ — $ (45) $ 8 $ — $ (41) $ — $ 3 $ —
State and municipal $ 67 $ — $ 102 $ 1,128 $ — $ (1,243) $ (10) $ 252 $ (35)
Foreign government (33) — (243) 1,556 — (797) (528) 521 (22)
Corporate (60) — 1,452 3,272 — (3,864) (2,564) 3,240 (680)
Equity securities (202) — (145) 191 — (376) — 244 (143)
Asset-backed securities 128 — 606 5,198 — (6,069) (1,682) 5,801 (779)
Other debt securities (170) — 185 1,573 — (680) (4) 2,209 68
Total trading securities $ (142) $ — $ 2,288 $ 18,171 $ 73 $(19,227) $(5,033) $15,258 $(1,630)
Derivatives, net (4)
)NTERESTæRATEæCONTRACTS $ (242) $ — $ 1,549 $ 111 $ — $ (21) $ 59 $ 726 $ 52
&OREIGNæEXCHANGEæCONTRACTS 31 — (83) 11 — (3) (153) (33) (100)
%QUITYæCONTRACTS 471 — (28) 362 — (242) (661) (1,737) (1,139)
#OMMODITYæCONTRACTS 426 — (83) 2 — (104) (152) (934) (48)
#REDITæDERIVATIVES 520 — 183 8 — (1) (1,278) 1,728 1,615
Total derivatives, net (4) $ 1,206 $ — $ 1,538 $ 494 $ — $ (371) $(2,185) $ (250) $ 380
Investments
Mortgage-backed securities
53æGOVERNMENTSPONSOREDæ
AGENCYæGUARANTEED $ — $ (22) $ 416 $ 270 $ — $ (7) $ — $ 679 $ (38)
0RIME — (1) (109) 7 — (54) (1) 8 —
!LT! — (1) — — — — — — —
3UBPRIME —————————
#OMMERCIAL — (4) (513) 42 — (52) — — —
Total investment mortgage-backed
debt securities $ — $ (28) $ (206) $ 319 $ — $ (113) $ (1) $ 687 $ (38)
U.S. Treasury and federal agency securities $ — $ — $ 60 $ — $ — $ (2) $ — $ 75 $ —
State and municipal — (10) (59) 324 — (92) — 667 (20)
Foreign government $ — $ 13 $ (21) $ 352 $ — $ (67) $ (188) $ 447 $ 6
Corporate — (106) 199 732 — (56) (305) 989 6
Equity securities — (38) (31) — — (84) (449) 1,453 —
Asset-backed securities — 43 55 106 — (460) (1,127) 4,041 5
Other debt securities — 26 121 35 — (289) (500) 120 (2)
Non-marketable equity securities — 862 (886) 4,881 — (1,838) (1,661) 8,318 580
Total investments $ — $ 762 $ (768) $ 6,749 $ — $ (3,001) $(4,231) $16,797 $ 537