Citibank 2011 Annual Report Download - page 48
Download and view the complete annual report
Please find page 48 of the 2011 Citibank annual report below. You can navigate through the pages in the report by either clicking on the pages listed below, or by using the keyword search tool below to find specific information within the annual report.-
 1
1 -
2
-
3
-
4
-
5
-
6
-
7
-
8
-
9
-
10
-
11
-
12
-
13
-
14
-
15
-
16
-
17
-
18
-
19
-
20
-
21
-
22
-
23
-
24
-
25
-
26
-
27
-
28
-
29
-
30
-
31
-
32
-
33
-
34
-
35
-
36
-
37
-
 38
38 -
 39
39 -
 40
40 -
 41
41 -
 42
42 -
 43
43 -
 44
44 -
 45
45 -
 46
46 -
 47
47 -
 48
48 -
 49
49 -
 50
50 -
 51
51 -
 52
52 -
 53
53 -
 54
54 -
 55
55 -
 56
56 -
 57
57 -
 58
58 -
59
-
60
-
61
-
62
-
63
-
64
-
65
-
66
-
67
-
68
-
69
-
70
-
71
-
72
-
73
-
74
-
75
-
76
-
77
-
78
-
79
-
80
-
81
-
82
-
83
-
84
-
85
-
86
-
87
-
88
-
89
-
90
-
91
-
92
-
93
-
94
-
95
-
96
-
97
-
98
-
99
-
100
-
101
-
102
-
103
-
104
-
105
-
106
-
107
-
108
-
109
-
110
-
111
-
112
-
113
-
114
-
115
-
116
-
117
-
118
-
119
-
120
-
121
-
122
-
123
-
124
-
125
-
126
-
127
-
128
-
129
-
130
-
131
-
132
-
133
-
134
-
135
-
136
-
137
-
138
-
139
-
140
-
141
-
142
-
143
-
144
-
145
-
146
-
147
-
148
-
149
-
150
-
151
-
152
-
153
-
154
-
155
-
156
-
157
-
158
-
159
-
160
-
161
-
162
-
163
-
164
-
165
-
166
-
167
-
168
-
169
-
170
-
171
-
172
-
173
-
174
-
175
-
176
-
177
-
178
-
179
-
180
-
181
-
182
-
183
-
184
-
185
-
186
-
187
-
188
-
189
-
190
-
191
-
192
-
193
-
194
-
195
-
196
-
197
-
198
-
199
-
200
-
201
-
202
-
203
-
204
-
205
-
206
-
207
-
208
-
209
-
210
-
211
-
212
-
213
-
214
-
215
-
216
-
217
-
218
-
219
-
220
-
221
-
222
-
223
-
224
-
225
-
226
-
227
-
228
-
229
-
230
-
231
-
232
-
233
-
234
-
235
-
236
-
237
-
238
-
239
-
240
-
241
-
242
-
243
-
244
-
245
-
246
-
247
-
248
-
249
-
250
-
251
-
252
-
253
-
254
-
255
-
256
-
257
-
258
-
259
-
260
-
261
-
262
-
263
-
264
-
265
-
266
-
267
-
268
-
269
-
270
-
271
-
272
-
273
-
274
-
275
-
276
-
277
-
278
-
279
-
280
-
281
-
282
-
283
-
284
-
285
-
286
-
287
-
288
-
289
-
290
-
291
-
292
-
293
-
294
-
295
-
296
-
297
-
298
-
299
-
300
-
301
-
302
-
303
-
304
-
305
-
306
-
307
-
308
-
309
-
310
-
311
-
312
-
313
-
314
-
315
-
316
-
317
-
318
-
319
-
320
 |
 |

26
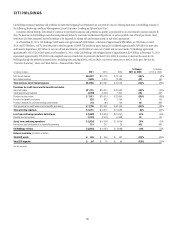
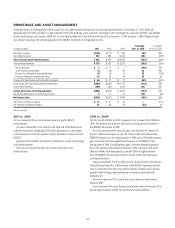
SECURITIES AND BANKING
Securities and Banking (S&B) offers a wide array of investment and commercial banking services and products for corporations, governments, institutional
and retail investors, and high-net-worth individuals. S&B transacts with clients in both cash instruments and derivatives, including fixed income, foreign
currency, equity, and commodity products. S&B includes investment banking and advisory services, lending, debt and equity sales and trading, institutional
brokerage, derivative services and private banking.
S&B revenue is generated primarily from fees and spreads associated with these activities. S&B earns fee income for assisting clients in clearing transactions,
providing brokerage and investment banking services and other such activities. Revenue generated from these activities is recorded in Commissions and fees.
In addition, as a market maker, S&B facilitates transactions, including holding product inventory to meet client demand, and earns the differential between
the price at which it buys and sells the products. These price differentials and the unrealized gains and losses on the inventory are recorded in Principal
transactions. S&B interest income earned on inventory and loans held is recorded as a component of Net interest revenue.
In millions of dollars 2011
% Change
2011 vs. 2010
æ#HANGEæ
æVSæ
.ETæINTERESTæREVENUE $ 9,116 (6)%
.ONINTERESTæREVENUE 12,301 (8)
Revenues, net of interest expense $21,417 (7)%
4OTALæOPERATINGæEXPENSES 15,028 2
.ETæCREDITæLOSSES 602 6
0ROVISIONæRELEASEæFORæUNFUNDEDæLENDINGæCOMMITMENTS 86 NM .-
#REDITæRESERVEæBUILDæRELEASE (572) (2) .-
0ROVISIONSæFORæLOANæLOSSESæANDæBENEFITSæANDæCLAIMS $ 116 NM .-
Income before taxes and noncontrolling interests $ 6,273 (26)%
)NCOMEæTAXES 1,378 (29)
Income from continuing operations 4,895 (25)
.ETæINCOMEæATTRIBUTABLEæTOæNONCONTROLLINGæINTERESTS 37 (66)
Net income $ 4,858 (24)%
!VERAGEæASSETSæ(in billions of dollars) $ 894 6%
2ETURNæONæASSETS 0.54%
Revenues by region
North America $ 7,558 (20)%
EMEA 7,221 5
Latin America 2,364 (7)
Asia 4,274 (1)
Total revenues $21,417 (7)%
Income from continuing operations by region
North America $ 1,011 (59)%
EMEA 2,008 11
Latin America 978 (10)
Asia 898 (21)
Total income from continuing operations $ 4,895 (25)%
Securities and BankingæREVENUEæDETAILS
4OTALæINVESTMENTæBANKING $ 3,310 (14)%
,ENDING 1,802 87 .-
%QUITYæMARKETS 2,756 (21)
&IXEDæINCOMEæMARKETS 12,263 (13)
0RIVATEæBANK 2,146 7
/THERæSecurities and Banking (860) 32
Total Securities and Banking revenues $21,417 (7)%
.-æ .OTæMEANINGFUL