Citibank 2011 Annual Report Download - page 203
Download and view the complete annual report
Please find page 203 of the 2011 Citibank annual report below. You can navigate through the pages in the report by either clicking on the pages listed below, or by using the keyword search tool below to find specific information within the annual report.-
 1
1 -
2
-
3
-
4
-
5
-
6
-
7
-
8
-
9
-
10
-
11
-
12
-
13
-
14
-
15
-
16
-
17
-
18
-
19
-
20
-
21
-
22
-
23
-
24
-
25
-
26
-
27
-
28
-
29
-
30
-
31
-
32
-
33
-
34
-
35
-
36
-
37
-
38
-
39
-
40
-
41
-
42
-
43
-
44
-
45
-
46
-
47
-
48
-
49
-
50
-
51
-
52
-
53
-
54
-
55
-
56
-
57
-
58
-
59
-
60
-
61
-
62
-
63
-
64
-
65
-
66
-
67
-
68
-
69
-
70
-
71
-
72
-
73
-
74
-
75
-
76
-
77
-
78
-
79
-
80
-
81
-
82
-
83
-
84
-
85
-
86
-
87
-
88
-
89
-
90
-
91
-
92
-
93
-
94
-
95
-
96
-
97
-
98
-
99
-
100
-
101
-
102
-
103
-
104
-
105
-
106
-
107
-
108
-
109
-
110
-
111
-
112
-
113
-
114
-
115
-
116
-
117
-
118
-
119
-
120
-
121
-
122
-
123
-
124
-
125
-
126
-
127
-
128
-
129
-
130
-
131
-
132
-
133
-
134
-
135
-
136
-
137
-
138
-
139
-
140
-
141
-
142
-
143
-
144
-
145
-
146
-
147
-
148
-
149
-
150
-
151
-
152
-
153
-
154
-
155
-
156
-
157
-
158
-
159
-
160
-
161
-
162
-
163
-
164
-
165
-
166
-
167
-
168
-
169
-
170
-
171
-
172
-
173
-
174
-
175
-
176
-
177
-
178
-
179
-
180
-
181
-
182
-
183
-
184
-
185
-
186
-
187
-
188
-
189
-
190
-
191
-
192
-
 193
193 -
 194
194 -
 195
195 -
 196
196 -
 197
197 -
 198
198 -
 199
199 -
 200
200 -
 201
201 -
 202
202 -
 203
203 -
 204
204 -
 205
205 -
 206
206 -
 207
207 -
 208
208 -
 209
209 -
 210
210 -
 211
211 -
 212
212 -
 213
213 -
214
-
215
-
216
-
217
-
218
-
219
-
220
-
221
-
222
-
223
-
224
-
225
-
226
-
227
-
228
-
229
-
230
-
231
-
232
-
233
-
234
-
235
-
236
-
237
-
238
-
239
-
240
-
241
-
242
-
243
-
244
-
245
-
246
-
247
-
248
-
249
-
250
-
251
-
252
-
253
-
254
-
255
-
256
-
257
-
258
-
259
-
260
-
261
-
262
-
263
-
264
-
265
-
266
-
267
-
268
-
269
-
270
-
271
-
272
-
273
-
274
-
275
-
276
-
277
-
278
-
279
-
280
-
281
-
282
-
283
-
284
-
285
-
286
-
287
-
288
-
289
-
290
-
291
-
292
-
293
-
294
-
295
-
296
-
297
-
298
-
299
-
300
-
301
-
302
-
303
-
304
-
305
-
306
-
307
-
308
-
309
-
310
-
311
-
312
-
313
-
314
-
315
-
316
-
317
-
318
-
319
-
320
 |
 |

181
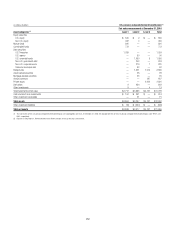
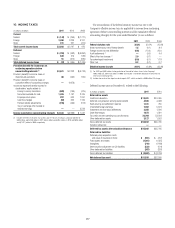
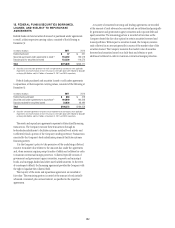
11. EARNINGS PER SHARE
The following is a reconciliation of the income and share data used in the basic and diluted earnings per share (EPS) computations for the years ended
December 31:
In millions, except per-share amounts 2011 (1) æ æ
Income (loss) from continuing operations before attribution of noncontrolling interests $ 11,103 æ
,ESSæ.ONCONTROLLINGæINTERESTSæFROMæCONTINUINGæOPERATIONS 148
Net income (loss) from continuing operations (for EPS purposes) $ 10,955 æ
)NCOMEæLOSSæFROMæDISCONTINUEDæOPERATIONSæNETæOFæTAXES 112
,ESSæ.ONCONTROLLINGæINTERESTSæFROMæDISCONTINUINGæOPERATIONS —
Citigroup’s net income (loss) $ 11,067 æ
,ESSæ)MPACTæOFæTHEæPUBLICæANDæPRIVATEæPREFERREDæSTOCKæEXCHANGEæOFFERS —
,ESSæ0REFERREDæDIVIDENDS 26
,ESSæ)MPACTæOFæTHEæCONVERSIONæPRICEæRESETæRELATEDæTOæTHEææBILLIONæ
CONVERTIBLEæPREFERREDæSTOCKæPRIVATEæISSUANCE —
,ESSæ0REFERREDæSTOCKæ3ERIESæ(æDISCOUNTæACCRETION —
Net income (loss) available to common shareholders $ 11,041 æ
,ESSæ$IVIDENDSæANDæUNDISTRIBUTEDæEARNINGSæALLOCATEDæTOæEMPLOYEEæRESTRICTEDæANDæ
DEFERREDæSHARESæTHATæCONTAINæNONFORFEITABLEæRIGHTSæTOæDIVIDENDSæAPPLICABLEæTOæBASICæ%03 186
Net income (loss) allocated to common shareholders for basic EPS (2) $ 10,855
!DDæ)NTERESTæEXPENSEæNETæOFæTAXæONæCONVERTIBLEæSECURITIESæANDæ
ADJUSTMENTæOFæUNDISTRIBUTEDæEARNINGSæALLOCATEDæTOæEMPLOYEEæ
RESTRICTEDæANDæDEFERREDæSHARESæTHATæCONTAINæNONFORFEITABLEæRIGHTSæ
TOæDIVIDENDSæAPPLICABLEæTOæDILUTEDæ%03 17
Net income (loss) allocated to common shareholders for diluted EPS (2) $ 10,872 æ
Weighted-average common shares outstanding applicable to basic EPS 2,909.8
%FFECTæOFæDILUTIVEæSECURITIES
#ONVERTIBLEæSECURITIES 0.1
/THERæEMPLOYEEæPLANS 0.5
/PTIONS 0.8
4$%#S 87.6
Adjusted weighted-average common shares outstanding applicable to diluted EPS (3) 2,998.8
Basic earnings per share
)NCOMEæLOSSæFROMæCONTINUINGæOPERATIONS $ 3.69 æ
$ISCONTINUEDæOPERATIONS 0.04
Net income (loss) $ 3.73 æ æ
Diluted earnings per share (2)(3)
)NCOMEæLOSSæFROMæCONTINUINGæOPERATIONS $ 3.59
$ISCONTINUEDæOPERATIONS 0.04
Net income (loss) $ 3.63 æ æ
æ !LLæPERSHAREæAMOUNTSæANDæ#ITIGROUPæSHARESæOUTSTANDINGæFORæALLæPERIODSæREFLECTæ#ITIGROUPSæFORæREVERSEæSTOCKæSPLITæWHICHæWASæEFFECTIVEæ-AYææ
æ $UEæTOæTHEæNETæLOSSæAVAILABLEæTOæCOMMONæSHAREHOLDERSæINææLOSSæAVAILABLEæTOæCOMMONæSTOCKHOLDERSæFORæBASICæ%03æWASæUSEDæTOæCALCULATEæDILUTEDæ%03æ)NCLUDINGæTHEæEFFECTæOFæDILUTIVEæSECURITIESæWOULDæRESULTæINæANTIDILUTION
æ $UEæTOæTHEæNETæLOSSæAVAILABLEæTOæCOMMONæSHAREHOLDERSæINææBASICæSHARESæWEREæUSEDæTOæCALCULATEæDILUTEDæ%03æ!DDINGæDILUTIVEæSECURITIESæTOæTHEæDENOMINATORæWOULDæRESULTæINæANTIDILUTION
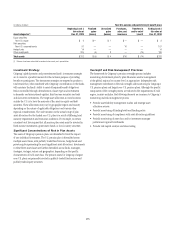
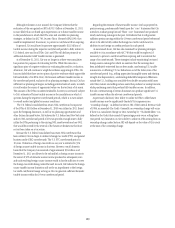
During 2011, 2010 and 2009, weighted-average options to purchase
24.1 million, 38.6 million and 16.6 million shares of common stock,
respectively, were outstanding but not included in the computation of
earnings per share because the weighted-average exercise prices of $123.47,
$102.89 and $315.65, respectively, were greater than the average market price
of the Company’s common stock.
Warrants issued to the U.S. Treasury as part of TARP and the loss-sharing
agreement (all of which were subsequently sold to the public in January
2011), with exercise prices of $178.50 and $106.10 for approximately
21.0 million and 25.5 million shares of common stock, respectively, were
not included in the computation of earnings per share in 2010 and 2009,
because they were anti-dilutive.
Equity awards granted under the Management Committee Long-Term
Incentive Plan (MC LTIP) were not included in the 2009 computation of
earnings per share because the performance targets under the terms of the
awards were not met and, as a result, the awards expired in the first quarter
of 2010.
The final tranche of equity units held by the Abu Dhabi Investment
Authority (ADIA) converted into 5.9 million shares of Citigroup common
stock during the third quarter of 2011. Equity units of approximately
11.8 million shares and 23.5 million shares of Citigroup common stock held
by ADIA were not included in the computation of earnings per share in 2010
and 2009, respectively, because the exercise price of $318.30 was greater than
the average market price of the Company’s common stock.