Citibank 2011 Annual Report Download - page 154
Download and view the complete annual report
Please find page 154 of the 2011 Citibank annual report below. You can navigate through the pages in the report by either clicking on the pages listed below, or by using the keyword search tool below to find specific information within the annual report.-
 1
1 -
2
-
3
-
4
-
5
-
6
-
7
-
8
-
9
-
10
-
11
-
12
-
13
-
14
-
15
-
16
-
17
-
18
-
19
-
20
-
21
-
22
-
23
-
24
-
25
-
26
-
27
-
28
-
29
-
30
-
31
-
32
-
33
-
34
-
35
-
36
-
37
-
38
-
39
-
40
-
41
-
42
-
43
-
44
-
45
-
46
-
47
-
48
-
49
-
50
-
51
-
52
-
53
-
54
-
55
-
56
-
57
-
58
-
59
-
60
-
61
-
62
-
63
-
64
-
65
-
66
-
67
-
68
-
69
-
70
-
71
-
72
-
73
-
74
-
75
-
76
-
77
-
78
-
79
-
80
-
81
-
82
-
83
-
84
-
85
-
86
-
87
-
88
-
89
-
90
-
91
-
92
-
93
-
94
-
95
-
96
-
97
-
98
-
99
-
100
-
101
-
102
-
103
-
104
-
105
-
106
-
107
-
108
-
109
-
110
-
111
-
112
-
113
-
114
-
115
-
116
-
117
-
118
-
119
-
120
-
121
-
122
-
123
-
124
-
125
-
126
-
127
-
128
-
129
-
130
-
131
-
132
-
133
-
134
-
135
-
136
-
137
-
138
-
139
-
140
-
141
-
142
-
143
-
 144
144 -
 145
145 -
 146
146 -
 147
147 -
 148
148 -
 149
149 -
 150
150 -
 151
151 -
 152
152 -
 153
153 -
 154
154 -
 155
155 -
 156
156 -
 157
157 -
 158
158 -
 159
159 -
 160
160 -
 161
161 -
 162
162 -
 163
163 -
 164
164 -
165
-
166
-
167
-
168
-
169
-
170
-
171
-
172
-
173
-
174
-
175
-
176
-
177
-
178
-
179
-
180
-
181
-
182
-
183
-
184
-
185
-
186
-
187
-
188
-
189
-
190
-
191
-
192
-
193
-
194
-
195
-
196
-
197
-
198
-
199
-
200
-
201
-
202
-
203
-
204
-
205
-
206
-
207
-
208
-
209
-
210
-
211
-
212
-
213
-
214
-
215
-
216
-
217
-
218
-
219
-
220
-
221
-
222
-
223
-
224
-
225
-
226
-
227
-
228
-
229
-
230
-
231
-
232
-
233
-
234
-
235
-
236
-
237
-
238
-
239
-
240
-
241
-
242
-
243
-
244
-
245
-
246
-
247
-
248
-
249
-
250
-
251
-
252
-
253
-
254
-
255
-
256
-
257
-
258
-
259
-
260
-
261
-
262
-
263
-
264
-
265
-
266
-
267
-
268
-
269
-
270
-
271
-
272
-
273
-
274
-
275
-
276
-
277
-
278
-
279
-
280
-
281
-
282
-
283
-
284
-
285
-
286
-
287
-
288
-
289
-
290
-
291
-
292
-
293
-
294
-
295
-
296
-
297
-
298
-
299
-
300
-
301
-
302
-
303
-
304
-
305
-
306
-
307
-
308
-
309
-
310
-
311
-
312
-
313
-
314
-
315
-
316
-
317
-
318
-
319
-
320
 |
 |

132
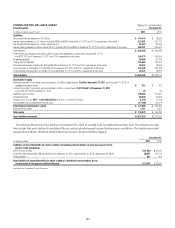
CONSOLIDATED BALANCE SHEET Citigroup Inc. and Subsidiaries
December 31,
In millions of dollars, except shares 2011
Assets
#ASHæANDæDUEæFROMæBANKSæINCLUDINGæSEGREGATEDæCASHæANDæOTHERæDEPOSITS $ 28,701
$EPOSITSæWITHæBANKS 155,784
&EDERALæFUNDSæSOLDæANDæSECURITIESæBORROWEDæORæPURCHASEDæUNDERæAGREEMENTSæTOæRESELLæINCLUDINGææANDæææ
ASæOFæ$ECEMBERæææANDææRESPECTIVELYæATæFAIRæVALUE 275,849
"ROKERAGEæRECEIVABLES 27,777
4RADINGæACCOUNTæASSETSæINCLUDINGææANDææPLEDGEDæTOæCREDITORSæATæ$ECEMBERæææANDææRESPECTIVELY 291,734
)NVESTMENTSæINCLUDINGææANDææPLEDGEDæTOæCREDITORSæATæ$ECEMBERæææANDææRESPECTIVELYæANDææANDæ
æATæ$ECEMBERæææANDææRESPECTIVELYæATæFAIRæVALUE 293,413
,OANSæNETæOFæUNEARNEDæINCOME
#ONSUMERæINCLUDINGææANDææASæOFæ$ECEMBERæææANDææRESPECTIVELYæATæFAIRæVALUE 423,731
#ORPORATEæINCLUDINGææANDææATæ$ECEMBERæææANDææRESPECTIVELYæATæFAIRæVALUE 223,511
,OANSæNETæOFæUNEARNEDæINCOME $ 647,242
!LLOWANCEæFORæLOANæLOSSES (30,115)
4OTALæLOANSæNET $ 617,127
'OODWILL 25,413
)NTANGIBLEæASSETSæOTHERæTHANæ-32S 6,600
-ORTGAGEæSERVICINGæRIGHTSæ-32S 2,569
/THERæASSETSæINCLUDINGææANDææASæOFæ$ECEMBERæææANDææRESPECTIVELYæATæFAIRæVALUE 148,911
Total assets $1,873,878
The following table presents certain assets of consolidated variable interest entities (VIEs), which are included in the Consolidated Balance Sheet above.
The assets in the table below include only those assets that can be used to settle obligations of consolidated VIEs on the following page, and are in excess of
those obligations. Additionally, the assets in the table below include third-party assets of consolidated VIEs only, and exclude intercompany balances that
eliminate in consolidation.
December 31,
In millions of dollars 2011
Assets of consolidated VIEs that can only be used to settle obligations of consolidated VIEs
#ASHæANDæDUEæFROMæBANKSæ $ 536
4RADINGæACCOUNTæASSETS 567
)NVESTMENTSæ 10,582
,OANSæNETæOFæUNEARNEDæINCOME
#ONSUMERæINCLUDINGææANDææASæOFæ$ECEMBERæææANDæ$ECEMBERæææRESPECTIVELYæFAIRæVALUE 103,275
#ORPORATEæINCLUDINGææANDææASæOFæ$ECEMBERæææANDæ$ECEMBERæææRESPECTIVELYæFAIRæVALUE 23,780
,OANSæNETæOFæUNEARNEDæINCOME $127,055
!LLOWANCEæFORæLOANæLOSSESæ (8,000)
4OTALæLOANSæNET $119,055
/THERæASSETSæ 859
Total assets of consolidated VIEs that can only be used to settle obligations of consolidated VIEs $131,599
Statement continues on the next page.